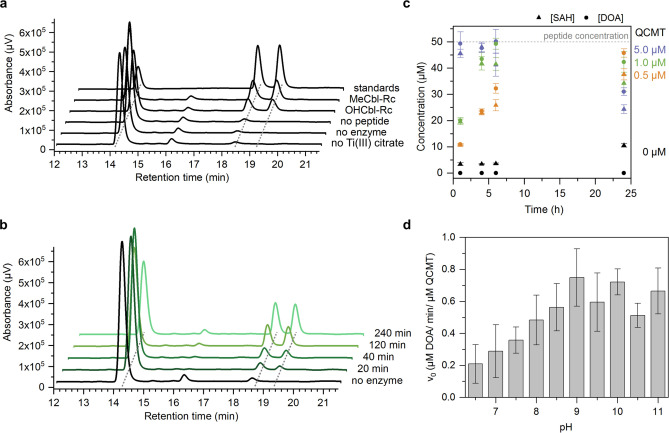
Figure 5.
Analysis of DOA and SAH formation during the QCMT‐catalyzed methylation reaction. a) HPLC chromatograms of standard solutions and in vitro activity assay mixtures. From top to bottom: standard solution with SAM (R t=14.1 min), SAH (R t=18.4 min) and DOA (R t=19.2 min), standard activity assay mixture with as‐purified QCMT (MeCbl‐Rc), with as‐purified QCMT (OHCbl‐Rc), standard activity assay mixture without peptide, without enzyme and without titanium(III) citrate. b) HPLC chromatograms of a standard activity assay mixture (1 μM QCMT, 200 μM SAM, 50 μM peptide, 1 mM titanium(III) citrate) showing the formation of DOA and SAH at different time points. c) Formation of DOA and SAH at different time points depending on the concentration of QCMT. Shown are mean values with standard deviation of n=3 independent activity assays with the same enzyme preparation. The SAH concentration detected in the negative control (0 μM QCMT) was subtracted from the SAH concentrations measured in the presence of 0.5, 1.0 and 5.0 μM QCMT, respectively. The decrease of DOA and SAH during prolonged incubation for 24 h in the assays containing either 5 μM or 1 μM enzyme might be due to minor enzyme impurities (such as MTA/SAH nucleosidase) or chemical degradation, which was not further investigated. d) pH optimum of QCMT activity. Shown are mean values with standard deviation of n=3–4 enzyme preparations. With each enzyme preparation the activity assay was repeated three times.

