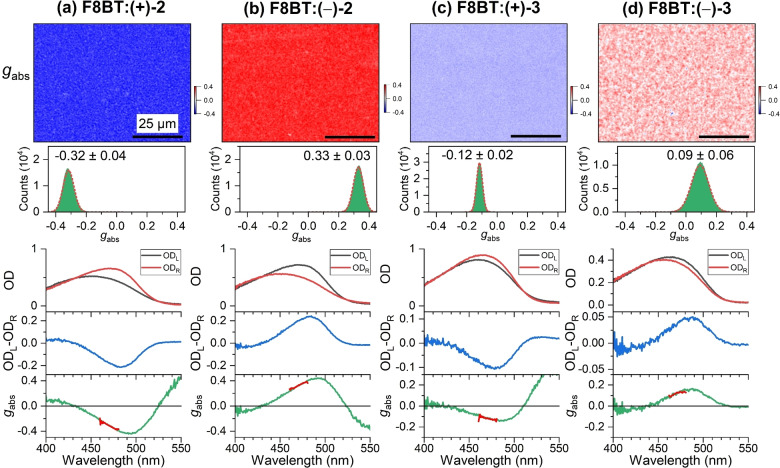
Figure 2.
CD microscopy for blends of the achiral polymer F8BT (1) and the two enantiomers of the helicene‐type molecules 2 and 3. a) Microscope image (80×60 μm2) showing the dissymmetry parameter g abs of an F8BT:(+)‐2 thin film (top) with the distribution of g abs values (middle) including a Gaussian fit (dashed red line), determined over the entire field of view, and corresponding spectra integrated over the entire field of view (210×160 μm2, three panels at the bottom) displaying the optical density for left‐ and right‐circularly polarized light (ODL (black line), ODR (red line)), the CD spectrum (ODL‐ODR, blue line) and the g abs spectrum (green line), with the thick red line indicating the spectral region selected by the bandpass filter (470 nm, FWHM 10 nm) used for CD imaging. b)–d) Same as in panel a, but for F8BT:(−)‐2, F8BT:(+)‐3 and F8BT:(−)‐3 thin films. The black scale bar in each CD image corresponds to a distance of 25 μm. In each case, 33 wt % of the helicene‐type additive was employed. The values for the film thickness in panels a–d were ca. 200 nm, ca. 250 nm, 202 nm and 156 nm, respectively.

