Figure 3.
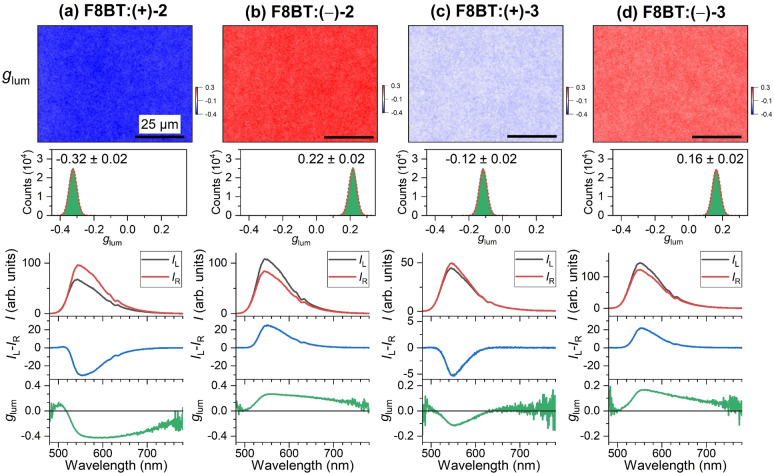
CPL microscopy for blends of the achiral polymer F8BT (1) and the two enantiomers of the helicene‐type molecules 2 and 3. a) Microscope image (80×60 μm2) showing the dissymmetry parameter g lum of an F8BT:(+)‐2 thin film (top) measured using a bandpass filter with a center wavelength of 560 nm (FWHM 10 nm), with the distribution of g lum values (middle) including a Gaussian fit (dashed red line), determined over the entire field of view, and corresponding spectra integrated over the entire field of view (210×160 μm2, three panels at the bottom) displaying the luminescence intensity for left‐ and right‐circularly polarized light (I L (black line), I R (red line)), the CPL spectrum (I L‐I R, blue line) and the g lum spectrum (green line). b)–d) Same as in panel a, but for F8BT:(−)‐2, F8BT:(+)‐3 and F8BT:(−)‐3 thin films. The black scale bar in each CPL image corresponds to a distance of 25 μm. In each case, 33 wt % of the helicene‐type additive was employed. The values for the film thickness in panels (a)–(d) were 198 nm, 251 nm, 150 nm and ca. 150 nm, respectively.

