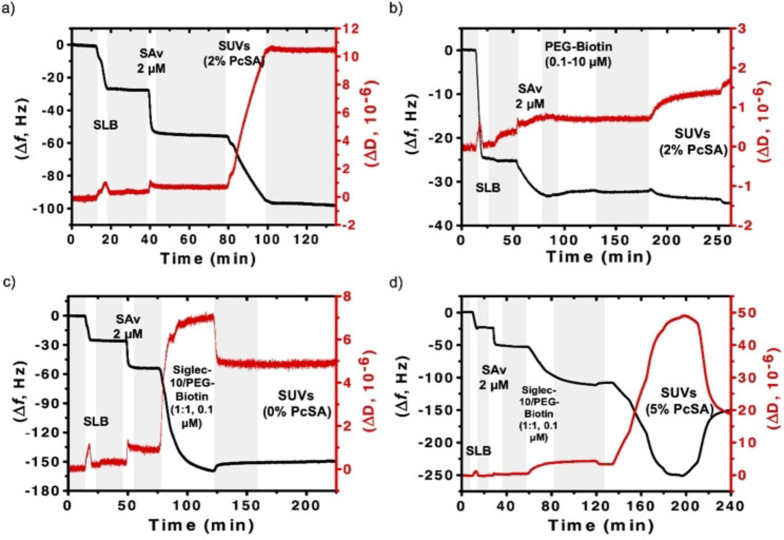
Figure 4.
QCM‐D measurements showing frequency shifts (Δf, black) and variations in dissipation (ΔD, red) for: a) formation of a SLB containing 2 % of DOPE‐biotin, adsorption of SAv and binding of DOPC‐Pc SUVs containing 2 % of PcSA (dilution 1 : 10). b) Formation of a SLB containing 2 % of DOPE‐biotin, adsorption of SAv and PEG‐biotin, and flow of DOPC‐Pc SUVs containing 2 % of PcSA (dilution 1 : 5). c) Formation of a SLB containing 2 % of DOPE‐biotin, adsorption of SAv and a mixture (1 : 1) of PEG‐biotin and biotinylated human siglec‐10, and flow of DOPC‐Pc SUVs containing 0 % of PcSA (dilutions 1 : 100–1 : 2). d) Formation of a SLB containing 2 % of DOPE‐biotin, adsorption of SAv and a mixture (1 : 1) of PEG‐biotin and biotinylated human siglec‐10, and binding of DOPC‐Pc SUVs containing 5 % of PcSA (dilutions 1 : 100–1 : 2). The 5th overtone was used in all experiments. Grey shades represent PBS flows.

