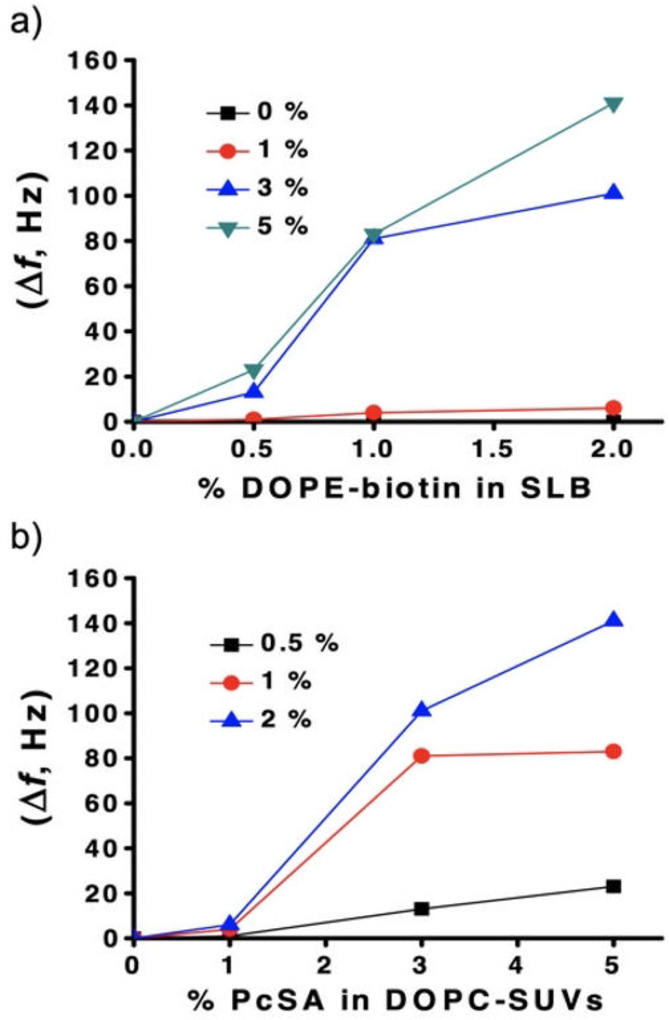
Figure 5.

a) Plot of Δf vs the mol % of DOPE‐biotin in the SLB, with different mol % of PcSA in DOPC‐SUVs. b) Plot of Δf (absolute values) vs the mol % of PcSA in DOPC‐SUVs, with different % of DOPE‐biotin at the SLB. The estimated standard deviation of Δf holds an upper limit of 20 %.
