Figure 3.
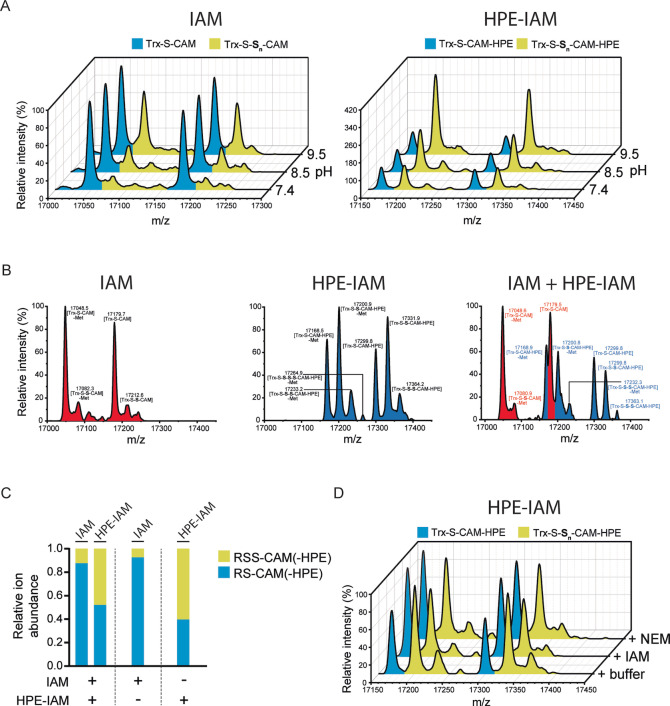
Alkylated persulfides differ in stability. A) Whole protein mass spectra of Trx1CS (13.5 μM) persulfidated with Na2S2 (300 μM) and alkylated with 1 mM of either IAM (left panel) or HPE‐IAM (right panel), at three different pH values. B) Whole protein mass spectra of Trx1CS persulfidated with Na2S2 and alkylated with either IAM (left panel) or HPE‐IAM (middle panel) or an equimolar mixture of IAM and HPE‐IAM (right panel) (1 mM each). Peaks corresponding to IAM‐modified proteins are highlighted in red and peaks corresponding to HPE‐IAM‐modified proteins are highlighted in blue. C) Quantification of the relative abundance of product species obtained in (B). D) Whole protein mass spectra of Trx1CS persulfidated with Na2S2, alkylated with HPE‐IAM and then reacted with either NEM or IAM (1 mM each). A)–D) Peaks corresponding to unmodified or thiol‐alkylated proteins are highlighted in blue and peaks corresponding to per‐/polysulfide‐alkylated proteins are highlighted in yellow.

