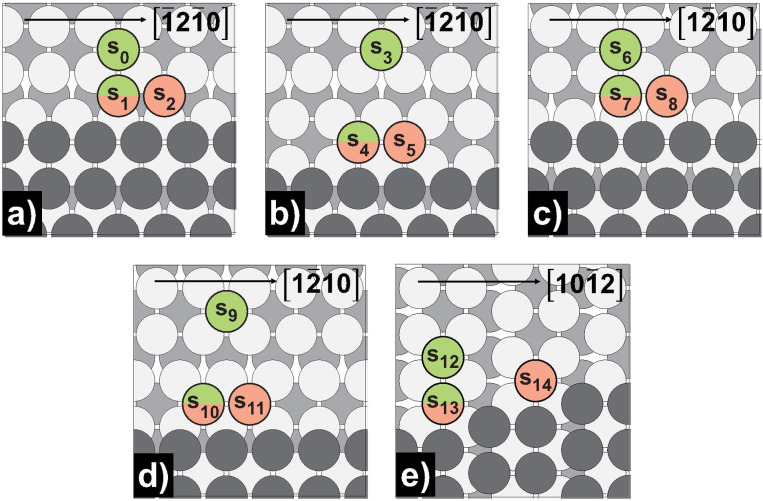
Figure 9.
Schematic representation of step‐edge self‐diffusion processes on Mg(10 1): a) step‐edge [ 2 0]A‐step; b) step‐edge [ 2 0]B‐step; c) step‐edge [1 10]A‐step; d) step‐edge [1 10]B‐step; e) step‐edge [10 2]‐step. Green‐colored atoms mark the initial, while red‐colored atoms mark the final positions.

