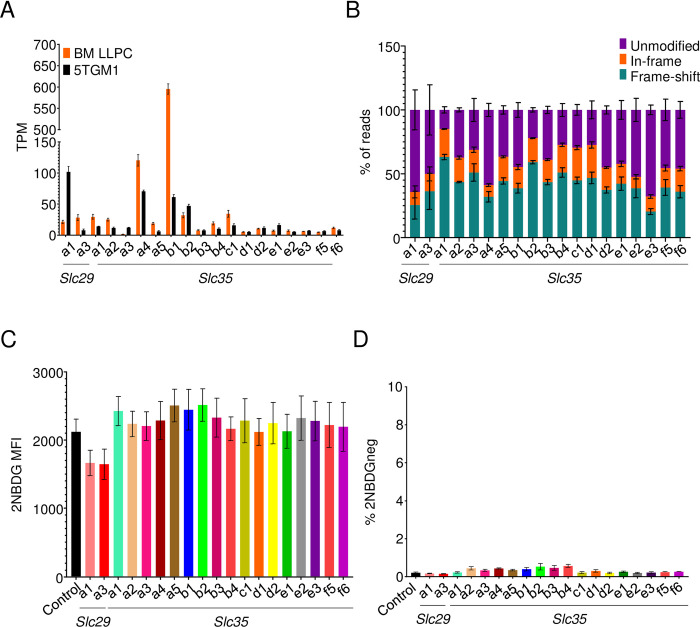
Fig 8. 2NBDG is not imported through nucleoside or nucleoside-sugar transporters.
(A) TPM values of nucleoside and nucleoside-sugar transporters in ex vivo bone marrow (orange) plasma cells and 5TGM1 cells (black). Mean values +/- SEM are shown. (B) Estimation of indels in nucleoside and nucleoside-sugar transporter deleted cultures done as in Fig 5B. Mean values +/- SEM shown for each of the genes and modifications within it. Pooled data from three independent experiments. (C) 2NBDG uptake in deleted cultures. 5TGM1-Cas9 cells transduced with gRNAs targeting indicated nucleoside or nucleoside-sugar transporters (colored) or with a control gRNA (black). 2NBDG MFIs across three independent experiments are quantified and displayed with SEM. (D) Frequencies of 2NBDG negative cells in cultures described in (C). Pooled data from three experiments. No statistical significance observed with the Brown-Forsyth and Welch one-way ANOVA multiple comparisons test.

