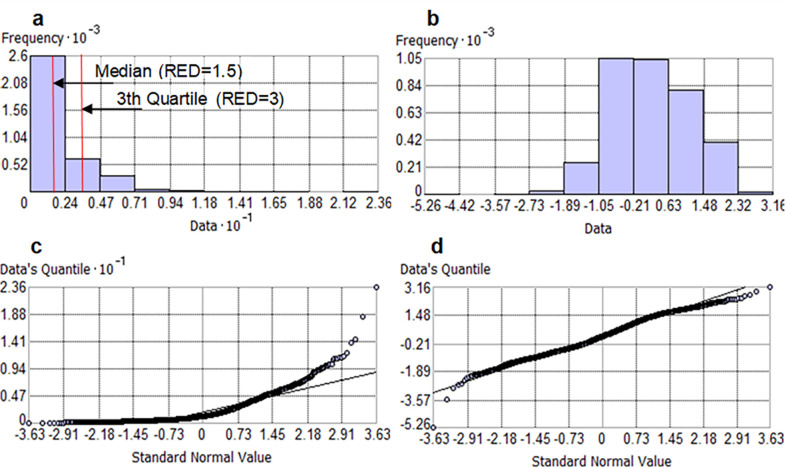
Fig 4. Exploratory data analysis and verification of normality of rainfall erosivity density (RED) data.
a) Distributional frequency on the original RED data and b) after log-normal transformation; c) QQ-Plot of the theoretical and estimated distribution of the original RED data and d) after log-normal transformation. Warning and alert thresholds (MJ hm-2 h-1) are shown in a).

