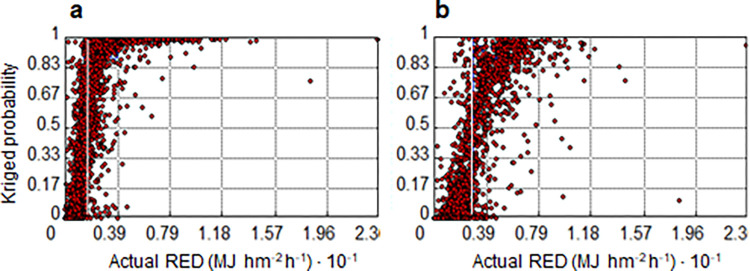
Fig 6. Cross-validation for warning and alert states.
Scatterplots between actual rainfall erosivity density (RED) values above the given threshold and LNOKpm probability for the thresholds a) zk (RED) > 1.5 MJ hm-2 h-1 and b) zk (RED) > 3.0 MJ hm-2 h-1. The white vertical lines in both graphs represent the respective RED thresholds (a, warning state; b, alert state). The cross-validation scatter diagrams (a and b) show that the actual RED values below and above the given thresholds at the warning and alert states are in agreement with the respective kriged probability.

