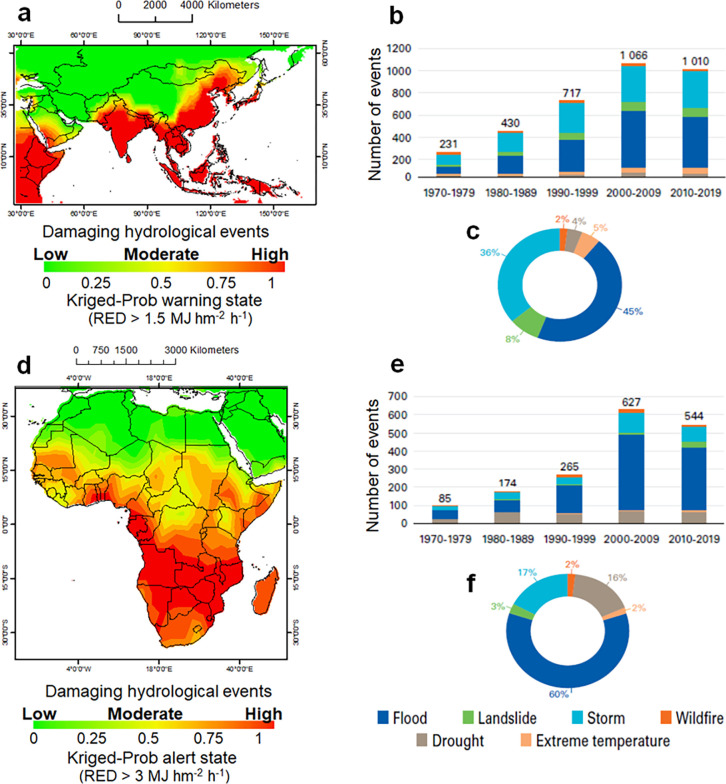
Fig 8. Comparison of kriged probability maps with damaging hydrological events (Asia) and flood events (Africa) over the last four-five decades.
a) Rainfall erosivity density (RED) > 1.5 MJ hm-2 h-1 with b) with trend of disasters and c) related percentage; d) Rainfall erosivity density (RED) > 3.0 MJ hm-2 h-1 with e) trend of disasters and f) related percentage. The graphs a) and d) refer to the period 2002–2011, graphs b), c), e) and f) to 1971–2019.

