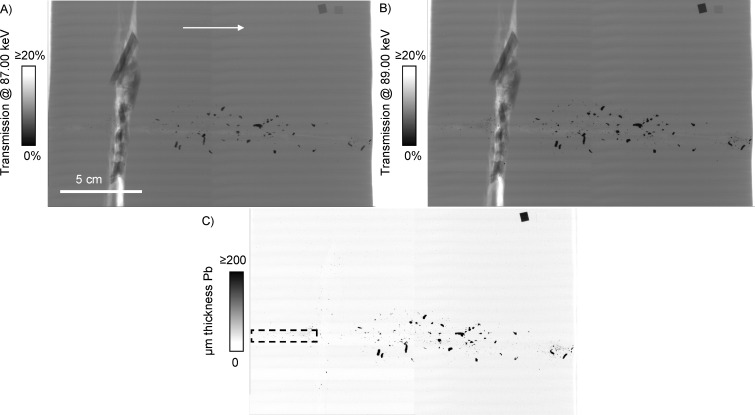
Fig 4. Lead K edge subtraction imaging of the lead-core bullet with bone sample.
The bullet trajectory is indicated by the arrow, and all images are on the same spatial scale. (A) Transmission image at 87.00 keV. (B) Transmission image at 89.00 keV. (A) and (B) are on the same contrast scale. (C) K edge subtraction image, with contrast scale of micrometer thickness of lead. All non-lead structures including bone and copper are subtracted out in the process. The dashed box in (C) outlines an area that was selected for high resolution imaging.

