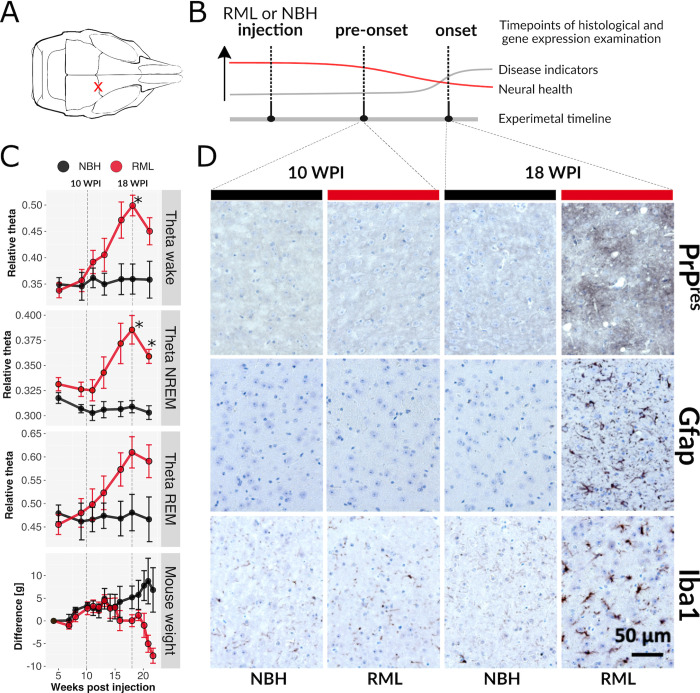
Fig 1. Gradual increase in EEG theta power and histopathological changes in RML.
(A) Location of RML and NBH injections, marked by a red X. (B) Conceptual experimental timeline for collection of tissues for translatome and histopathological analysis, in relation to disease progression. At the pre-onset stage mice appear normal and lack disease indicators, but neural health begins to decline. (C) Summarized EEG theta power of wake (top), NREM sleep (second from top) and REM sleep (third from top) mice injected with RML (red) or NBH (black) juxtaposed with weekly percentage body weight measurement (expressed as deviation from initial weight) of the same mouse cohorts (bottom). Two-factor mixed ANOVA tests demonstrate significant difference in all four measurements (respectively: F [6,48] = 8.9, p-value < 0.001; F [6,48] = 6.9, p-value < 0.001; F [6,48] = 8.3, p-value < 0.001; F(14,98) = 4.8, p-value < 0.001). Differences were significant (p-value ≤ 0.05, Holm-Šídák test) at 18 WPI for wake and NREM and at 21 WPI for NREM (marked by *). (D) Immunohistochemistry staining of thalamus of RML infected and control (mice injected with NBH) 4 μm thick formalin fixed paraffin embedded brain sections at 10 and 18 WPI. Staining with SAF84 prion protein antibody (brown) after proteinase K treatment to detect aggregated PrP (PrPres, top row), staining with GFAP antibody (dark brown) to detect astrogliosis (middle row) and staining with Iba1 antibody (dark brown) to detect microglia activation (bottom row). All sections were counterstained with hematoxylin. Spongiosis is apparent in the context of the intense SAF84 staining. Scale bar represents 50 μm and applies to all images.

