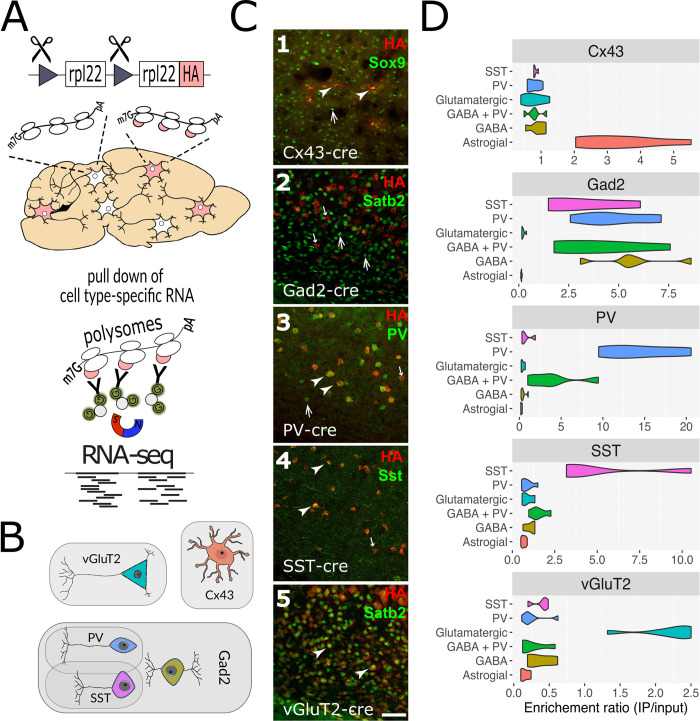
Fig 2. RiboTag activation and validation.
(A) The RiboTag system is activated in cells with Cre activity through site-directed recombination in Rpl22 to make Rpl22-HA (RiboTag). Frozen mouse brain tissue is homogenized, creating a mix of mRNAs attached to either normal ribosomes (white oval bubbles) or RiboTagged ribosomes (white oval bubbles with pink tags) made specifically by Cre+ cells. Cell-type-specific, ribosome associated mRNA is isolated by RiboTag IP with HA antibody and protein G magnetic beads. mRNA from Cre+ cells is then sequenced. (B) Cell types used in these studies. Shaded areas reflect the expression overlap between Gad2, PV and SST Cre lines. (C) Confocal images of cortex following double immunofluorescence labeling of HA (RiboTag) and representative histological cell-type markers. Cell type markers used (from 1 to 5 respectively): Astrocytes (Sox9), GABAergic cells (Satb2; glutamatergic cell marker to highlight the lack of colocalization with GABAergic neurons), PV neurons (PV), SST neurons (Sst), glutamatergic neurons (Satb2). Examples for double-positive cells are indicated by arrowheads, HA-/marker+ cells by upward pointing arrows, HA+/marker- cells by downward pointing and smaller arrows. Scale bar indicates 50 μm (identical for all panels). C1: specific HA-labeled astrocyte-like shaped cells colocalize with Sox9 in Cnx43-Cre/RiboTag mice. C2: Complete separation of HA and the glutamatergic marker, Satb2, in Gad2-Cre/RiboTag mice was observed. C3: PV and HA show substantial colocalization in PV-Cre/RiboTag mice. C4: All Sst+ cells were co-labeled for HA, although there were several HA+/SST- cells in SST-Cre/RiboTag mice. C5: Nearly all cells were co-labeled for HA and the nuclear marker for glutamatergic neurons, Satb2, in the vGlut2-cre/RiboTag mice. (D) Violin plots showing RiboTag IP specificity; each violin summarizes absolute expression (TPM) ratios (X-axis) of known cell type markers in IP samples and corresponding input (total RNA) samples (Y-axis).

