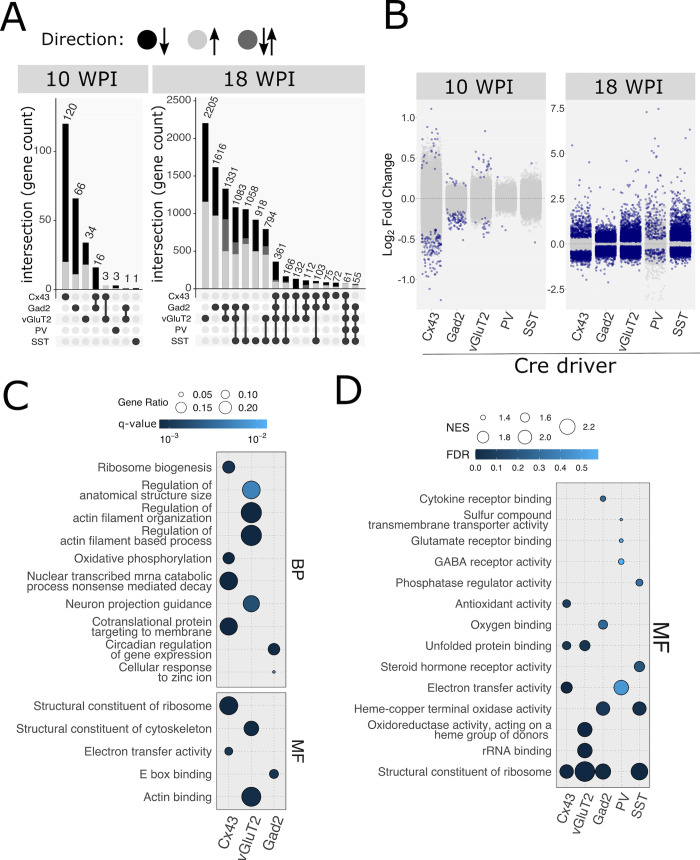
Fig 3. Overview of translatome changes.
(A) Numbers of differentially expressed genes (DEGs). Values represent numbers of genes found to be differentially expressed (FDR ≤ 0.1) in a single or combination of cell types studied. Combinations are marked by dumbbell-shaped symbols below the plots. The shade of grey corresponds to the directionality of changes (see legend above the panel). For 18 WPI all clusters containing < 100 genes were omitted. Note that for 10 WPI, the changes in the 3 affected cell types: astrocytes, glutamatergic cells and GABA cells are mostly non-overlapping (respectively, 120, 66, and 34) (B) Visualization of DEGs (FDR ≤ 0.1; dark blue) and non-DEGs (FDR > 0.1; light grey) in all cell types and timepoints. Y-axis represents log2 fold change, X-axis represents cell type. (C) Overrepresentation analysis of DEGs in the affected cell types at 10 WPI. Significantly enriched categories were shown for molecular function (MF) and biological process (BP) gene ontology subsets. Categories related to translation, cytoskeletal regulation and circadian rhythm were the most enriched in astrocytes, glutamatergic neurons and GABAergic neurons, respectively. (D) Gene set enrichment analysis (GSEA) in all cell types analyzed at 18 WPI. Significantly enriched categories were shown for the MF gene ontology subset. The most prominent categories were related to translation and terminal oxidation (mitochondrial respiration). Cell type legend for all panels: Cx43: astrocytes, Gad2: GABAergic cells, vGluT2: glutamatergic neurons, PV, parvalbumin neurons, SST: Somatostatin neurons. NES is Normalized Enrichment Score [91].

