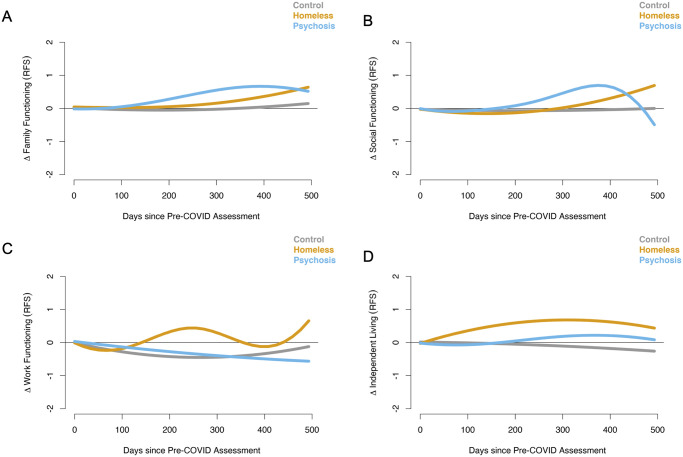
Fig 2. Results for the GAM analyses of community integration outcomes.
The smoothed curves represent the change over time in trajectories for controls (CTL; gray), recently housed Veterans (RHV; yellow), and Veterans with psychosis (PSY; blue). In all cases, higher scores indicate better functioning. The panels show results for A) family functioning, B) social functioning, C) work outcomes, and D) independent living.

