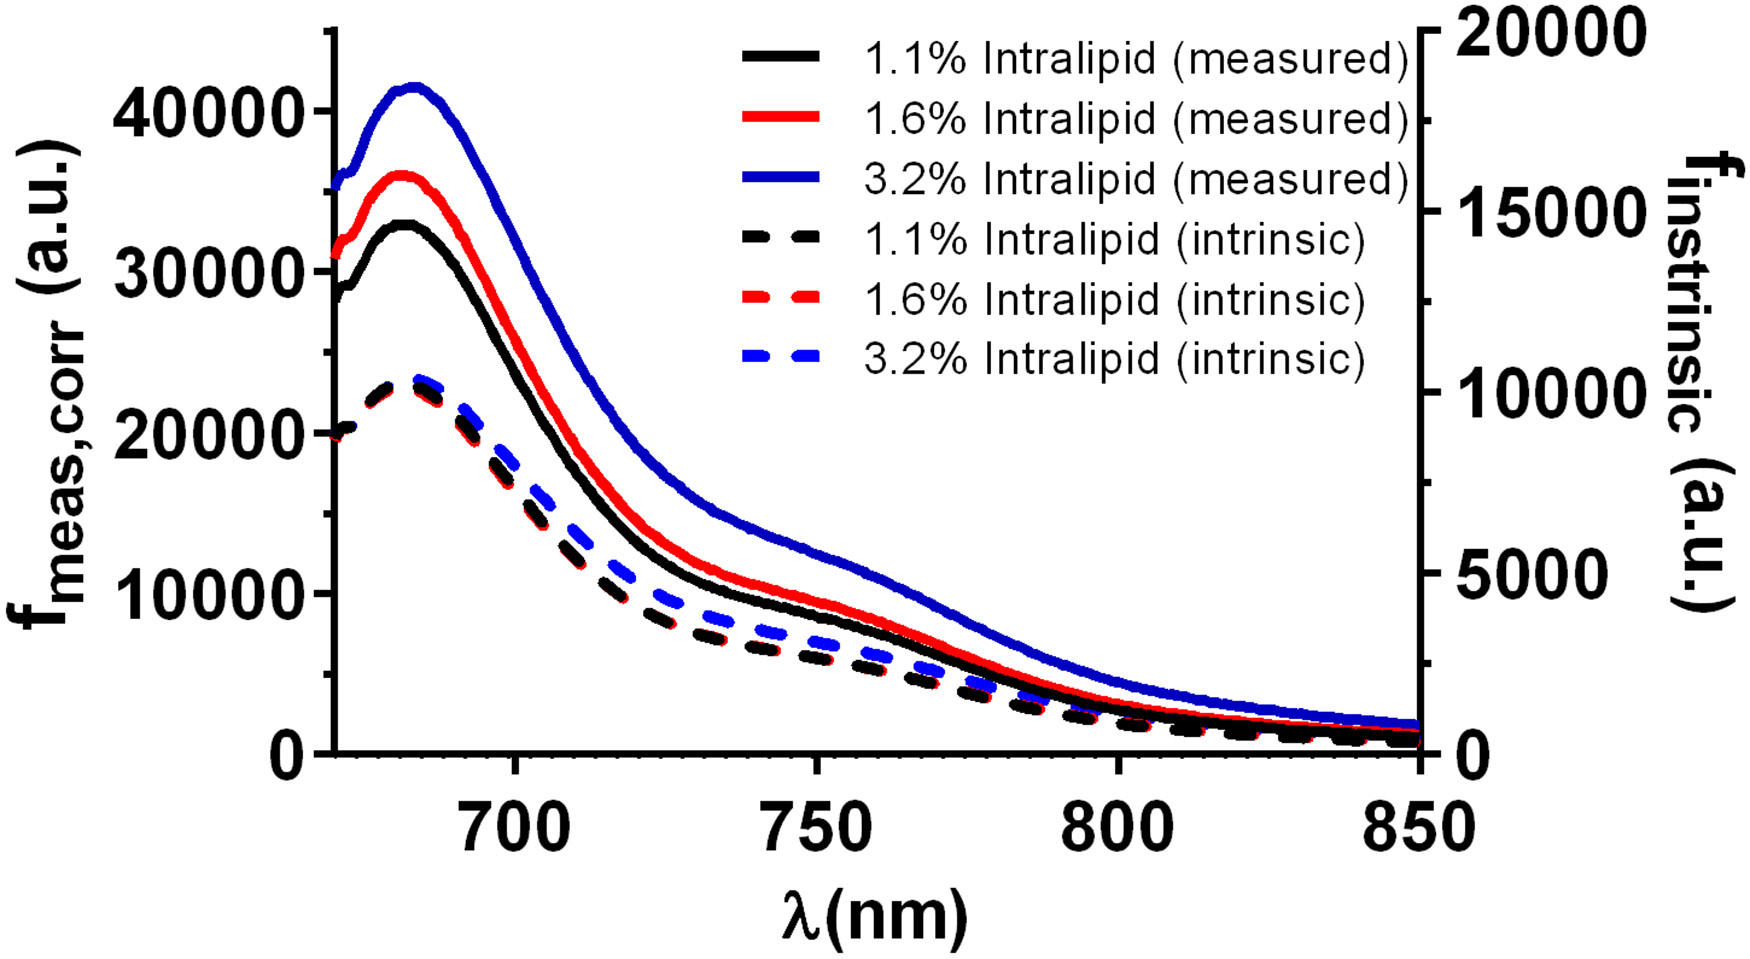
Figure 2.

Fluorescence spectra captured at a source-detector separation of 288 μm and [MB] = 3.2 μM, prior to and following the correction shown in Equation 1. Solid lines correspond to measured fluorescence spectra that have been corrected for dark background, integration time, measured optical power, and system throughput. Dashed lines refer to corresponding intrinsic fluorescence spectra that have been corrected using Equation 1. Note that measured fluorescence magnitude is shown on the left y-axis, while recovered intrinsic fluorescence is on the right y-axis.
