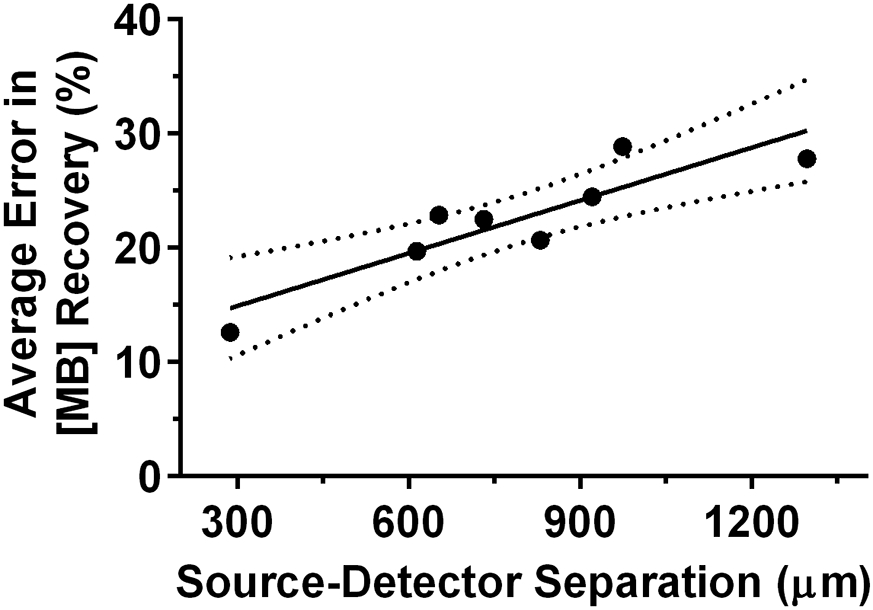
Figure 4.

Relationship between average error in recovery of methylene blue concentration using a single detector fiber and the source-detector separation for that fiber. The solid line represents a linear regression fit, with dotted lines corresponding to the 95% confidence interval.
