Figure 3.
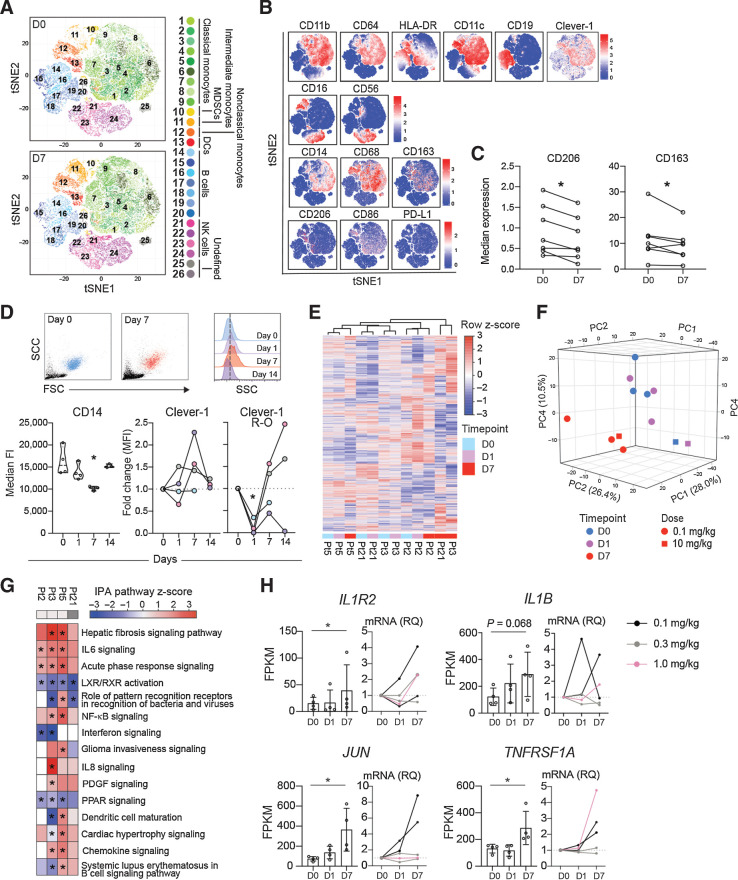
FP-1305 binds circulating CD14+ monocytes and suppresses LXR/RXR and PPAR signaling pathways. A, T-distributed stochastic neighbor embedding (tSNE) of CD3-excluded circulating mononuclear cells from D0 (N = 7) and D7 (N = 7) samples pre-gated for viability, singlets, and CD45+ cells. B, tSNE heatmaps showing expression of indicated markers on cell clusters of a representative patient (D0 and D7). C, Median expression of CD206 and CD163 on CD14+ monocytes on D0 and D7; paired Student's t test. D, Representative flow cytometry plots on D0 (blue) and D7 (red) showing size (FSC) and granularity (SSC) of CD14high monocytes (dashed line in half-offset histograms shows median SSC fluorescence on D0) and median expression of CD14 and Clever-1 (9-11 antibody) at different timepoints during treatment cycle 1. Pt2 (gray), Pt3 (pink), Pt5 (lilac), Pt21 (light blue). Clever-1 R-O by administered FP-1305 was detected by competitive binding of fluorochrome-conjugated FP-1305. One-way ANOVA performed between D0, D1, and D7 samples. E, Unsupervised hierarchical clustering of 13,589 genes expressed in CD14+ monocytes obtained from 4 patients across D0, D1, and D7 samples. F, Principal component analysis of patient samples across different timepoints. G, Ingenuity Pathway analysis of patient gene expression changes on D7 compared with predose (D0). Red color indicates predicted pathway activation and blue color inhibition. Light gray denotes 0.1 mg/kg dose and dark grey 10 mg/kg. H, FPKM values and qPCR validation of gene expression changes involved in relevant pathways. RNA sequenced Pt2 and Pt3 are marked in black. *, P < 0.05.

