. 2021 Jun 2;27(15):4205–4220. doi: 10.1158/1078-0432.CCR-20-4862

Figure 5.

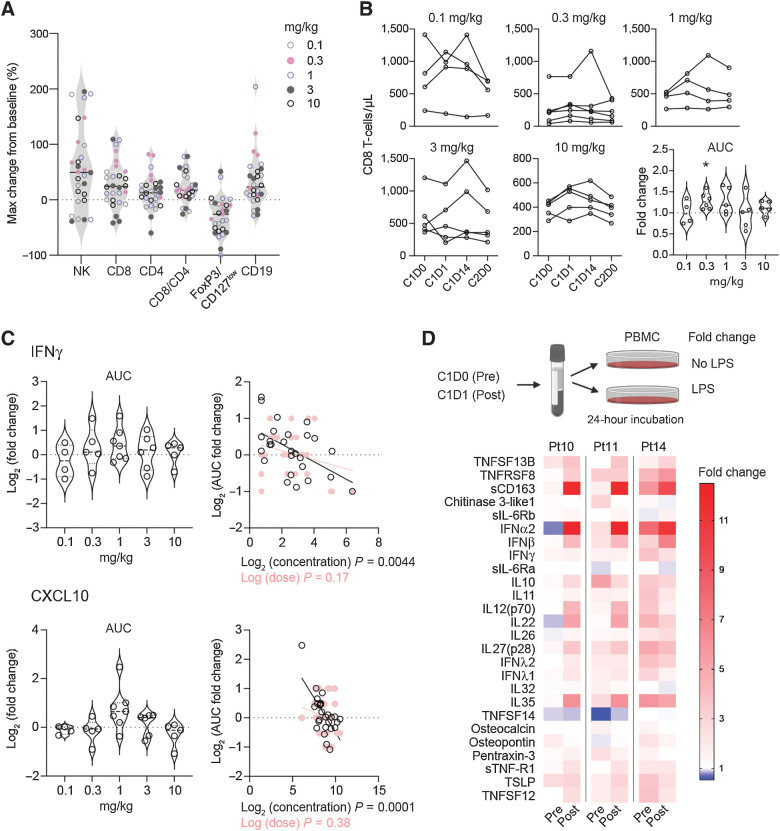
Figure 5. FP-1305 reinvigorates patient responses to inflammatory stimuli by increasing interferon secretion. A, Maximum relative change in the absolute numbers of blood lymphocyte populations during cycle 1 in all patients. B-cell changes were measured during cycles 1–4 due to slower kinetics. B, Absolute CD8+ T-cell numbers and AUC during cycle 1, shown by dose level. The AUCs were analyzed from patients with samples from all timepoints and a fold change was calculated against an AUC using each patient's predose cell number, which was considered to remain constant throughout cycle 1. Statistical analysis was performed with Wilcoxon's matched-pairs signed rank test. C, AUC fold change for systemic IFNγ and CXCL10 in MATINS patients during cycle 1. No significant differences between doses were observed with Wilcoxon's matched-pairs signed rank test. The right-hand plots show linear regression analysis of log2 transformed values of AUC fold change with predose concentrations (pg/mL) and dose (0.1–10 mg/kg). Each dot represents one patient (A–C). D, Schematic of TLR4-specific LPS stimulation of patient PBMCs ex vivo on D0 and D1 and heatmap of LPS-induced secreted factors on D0 and D1 shown as fold change relative to unstimulated cells. *, P < 0.05; **, P < 0.01; ***, P < 0.001.

FP-1305 reinvigorates patient responses to inflammatory stimuli by increasing interferon secretion. A, Maximum relative change in the absolute numbers of blood lymphocyte populations during cycle 1 in all patients. B-cell changes were measured during cycles 1–4 due to slower kinetics. B, Absolute CD8+ T-cell numbers and AUC during cycle 1, shown by dose level. The AUCs were analyzed from patients with samples from all timepoints and a fold change was calculated against an AUC using each patient's predose cell number, which was considered to remain constant throughout cycle 1. Statistical analysis was performed with Wilcoxon's matched-pairs signed rank test. C, AUC fold change for systemic IFNγ and CXCL10 in MATINS patients during cycle 1. No significant differences between doses were observed with Wilcoxon's matched-pairs signed rank test. The right-hand plots show linear regression analysis of log2 transformed values of AUC fold change with predose concentrations (pg/mL) and dose (0.1–10 mg/kg). Each dot represents one patient (AC). D, Schematic of TLR4-specific LPS stimulation of patient PBMCs ex vivo on D0 and D1 and heatmap of LPS-induced secreted factors on D0 and D1 shown as fold change relative to unstimulated cells. *, P < 0.05; **, P < 0.01; ***, P < 0.001.