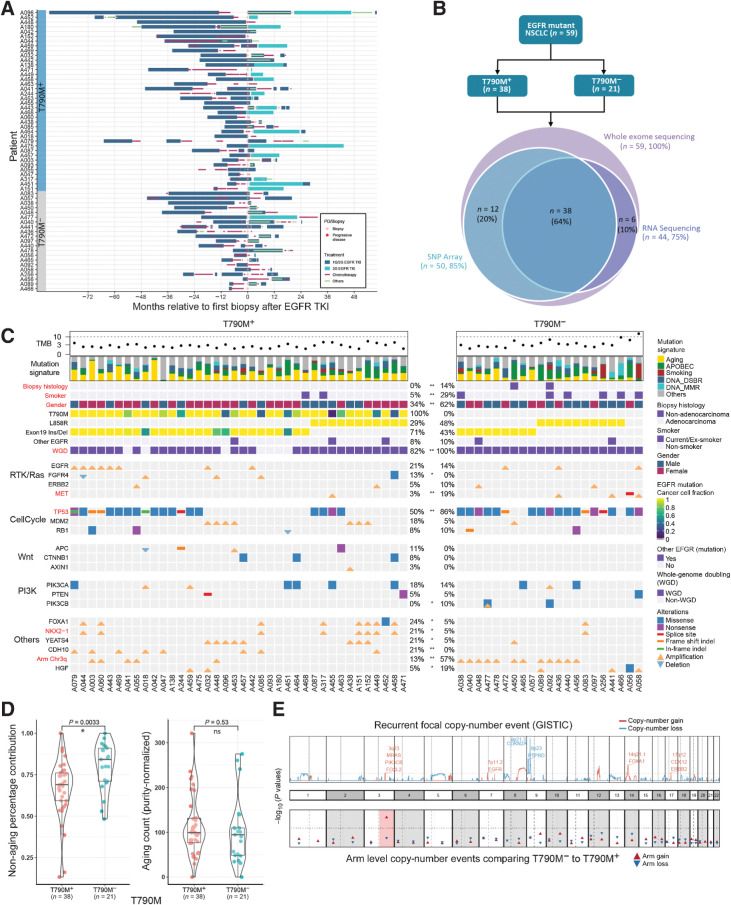
Figure 1.
Genomic correlates of EGFR TKI resistance. A, Treatment histories for individual patients; each bar color represents a treatment type. B, Sequencing experiments conducted in this study. C, Genomic landscape of EGFR TKI resistance. Mutations shown are previously proposed mechanisms (EGFR, ERBB2 and MET amplification; MDM2, RB1, PIK3CA, PTEN, PIK3CB alterations) or alterations in >5 patients that were significantly different between T790M+ and T790M− cohorts (*, P < 0.10; **, P < 0.05). Significant differences between T790M+ and T790M− tumors are highlighted in bold red color. WGD: whole-genome doubling. Other EGFR: any other EGFR mutations besides L858R and exon 19 indel. D, Left, relative contribution of aging signature mutations comparing T790M+ and T790M− cohorts. Right, the absolute number of aging mutations (adjusted for tumor purity) are similar between T790M+ and T790M− tumors. E, (Top) Recurrent focal copy-number events (red: amplification; blue: deletion). Bottom, P values comparing proportion of samples with chromosomal arm events between T790M+ and T790M− cohorts. Chromosome 3q gain (highlighted in red) is the only significant event.

