. 2021 Jul 14;27(21):5939–5950. doi: 10.1158/1078-0432.CCR-20-4607

Figure 2.

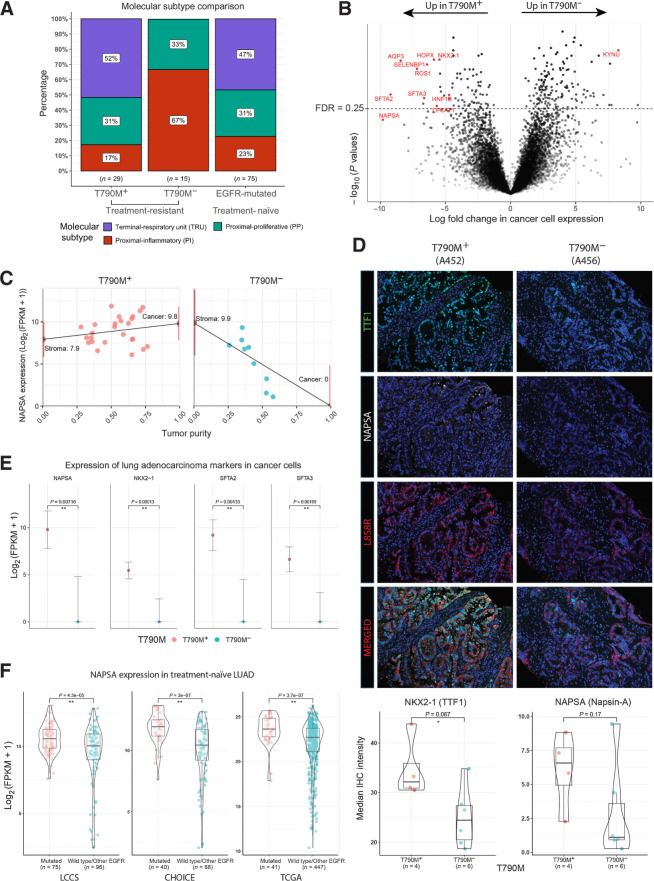
Figure 2. Tumor transcriptomic correlates of EGFR TKI resistance. A, Proportions of molecular transcriptomic subtype assigned to EGFR TKI-resistant tumors and treatment-naïve EGFR-mutated tumors. B, Volcano plot of log10(P values) against log-fold change in cancer cell expression of all genes tested. Lung adenocarcinoma markers (NAPSA, NKX2–1, SFTA2, and SFTA2) and other pulmonary differentiation markers are highlighted in red (Supplementary Table S4). C, Illustration of tumor transcriptome deconvolution approach for napsin-A (NAPSA). NAPSA gene expression is strongly correlated with purity in T790M− but not T790M+ tumors. NAPSA expression is inferred for a tumor with 0% (stroma) and 100% (cancer) tumor purity. Only lung tumor tissue and samples without abnormal high expression of squamous or neuroendocrine related genes are used for (B) and (C). D, Multiplex IHC staining of NAPSA, NKX2–1, and L858R (Surrogate for cancer cells). Images shown represent two tumors with striking difference in the IHC staining. Bottom, Bar–violin plots compare the median IHC intensity in NAPSA and NKX2–1 in all cells stained for L858R for each individual tumor with IHC data available. E, Cancer cell expression of lung adenocarcinoma markers comparing T790M+ and T790M− cohorts. F, Bulk tumor expression of lung adenocarcinoma markers comparing treatment-naïve EGFR-mutated and EGFR wild-type tumors across three public cohorts.

Tumor transcriptomic correlates of EGFR TKI resistance. A, Proportions of molecular transcriptomic subtype assigned to EGFR TKI-resistant tumors and treatment-naïve EGFR-mutated tumors. B, Volcano plot of log10(P values) against log-fold change in cancer cell expression of all genes tested. Lung adenocarcinoma markers (NAPSA, NKX2–1, SFTA2, and SFTA2) and other pulmonary differentiation markers are highlighted in red (Supplementary Table S4). C, Illustration of tumor transcriptome deconvolution approach for napsin-A (NAPSA). NAPSA gene expression is strongly correlated with purity in T790M but not T790M+ tumors. NAPSA expression is inferred for a tumor with 0% (stroma) and 100% (cancer) tumor purity. Only lung tumor tissue and samples without abnormal high expression of squamous or neuroendocrine related genes are used for (B) and (C). D, Multiplex IHC staining of NAPSA, NKX2–1, and L858R (Surrogate for cancer cells). Images shown represent two tumors with striking difference in the IHC staining. Bottom, Bar–violin plots compare the median IHC intensity in NAPSA and NKX2–1 in all cells stained for L858R for each individual tumor with IHC data available. E, Cancer cell expression of lung adenocarcinoma markers comparing T790M+ and T790M cohorts. F, Bulk tumor expression of lung adenocarcinoma markers comparing treatment-naïve EGFR-mutated and EGFR wild-type tumors across three public cohorts.