. 2021 Jul 14;27(21):5939–5950. doi: 10.1158/1078-0432.CCR-20-4607

Figure 3.

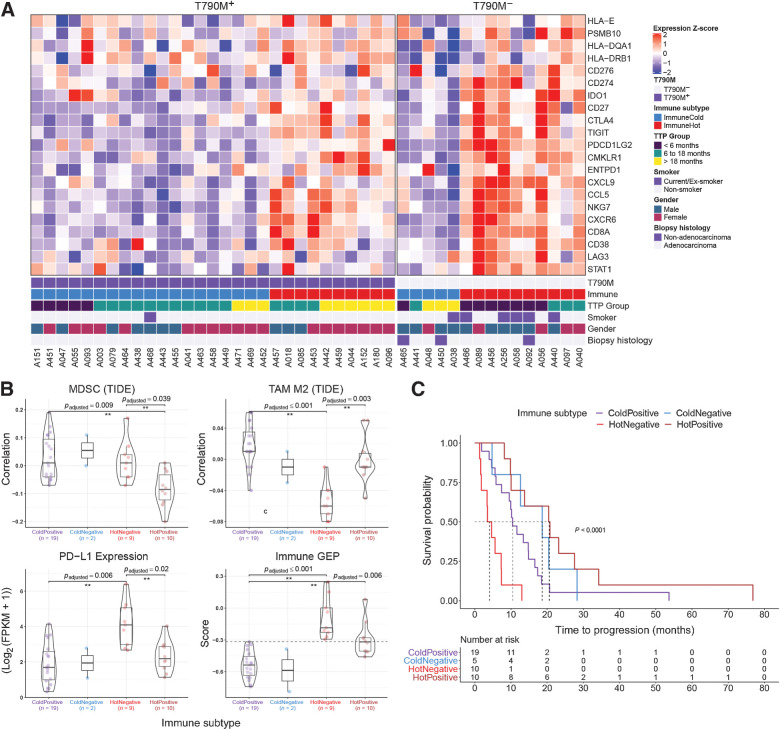
Figure 3. Stromal transcriptomic correlates of EGFR TKI resistance. A, Relative expression of genes used in the immune GEP calculation (39). Patients were clustered into two groups using consensus k-mean clustering and sorted by T790M status followed by time to progression (TTP). B, Comparison of immune-suppressive cells correlation index (derived using TIDE) and expression levels of immune checkpoint genes (PD-L1 gene expression shown here) between immune subtypes. Immune GEP score was calculated using the method from Cristescu et al. (39). Horizontal line demarcates GEP score of −0.318, defined as the cutoff for high GEP in the original article. Pairwise comparison test was carried out using Games–Howell test and P values were adjusted using Benjamin–Hochberg procedure. C, Kaplan–Meier curve of EGFR TKI TTP comparing different immune subtypes.

Stromal transcriptomic correlates of EGFR TKI resistance. A, Relative expression of genes used in the immune GEP calculation (39). Patients were clustered into two groups using consensus k-mean clustering and sorted by T790M status followed by time to progression (TTP). B, Comparison of immune-suppressive cells correlation index (derived using TIDE) and expression levels of immune checkpoint genes (PD-L1 gene expression shown here) between immune subtypes. Immune GEP score was calculated using the method from Cristescu et al. (39). Horizontal line demarcates GEP score of −0.318, defined as the cutoff for high GEP in the original article. Pairwise comparison test was carried out using Games–Howell test and P values were adjusted using Benjamin–Hochberg procedure. C, Kaplan–Meier curve of EGFR TKI TTP comparing different immune subtypes.