. 2021 Aug 10;27(20):5619–5627. doi: 10.1158/1078-0432.CCR-21-1414

Figure 4.

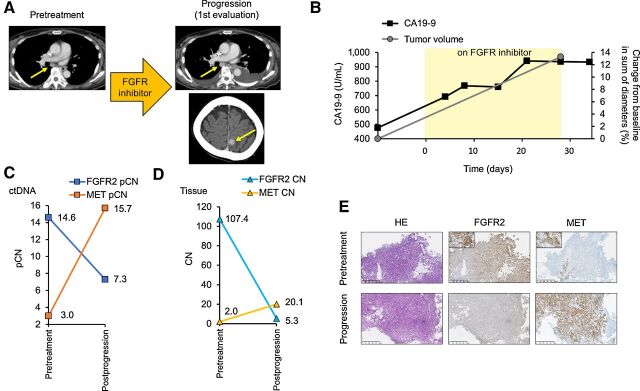
Figure 4. Clinical presentation. A, Tumor evaluation by CT at pretreatment and progression on an FGFR inhibitor with progressive lymph node enlargement and the emergence of a new brain metastasis (yellow arrows) in patient 3. B, Changes in CA 19-9 and sum of diameters of target lesions by CT following treatment with an FGFR inhibitor. C, Change in the ctDNA pCN of FGFR2 and MET amplification before treatment and at progression on an FGFR inhibitor. D, Change in the tissue CN of FGFR2 and MET amplification before treatment and at progression on FGFR inhibitor. E, Hematoxylin and eosin–stained and IHC-stained images with anti-FGFR2 and MET antibodies of biopsy specimens of the primary gastric cancer before treatment and at progression on an FGFR inhibitor.

Clinical presentation. A, Tumor evaluation by CT at pretreatment and progression on an FGFR inhibitor with progressive lymph node enlargement and the emergence of a new brain metastasis (yellow arrows) in patient 3. B, Changes in CA 19-9 and sum of diameters of target lesions by CT following treatment with an FGFR inhibitor. C, Change in the ctDNA pCN of FGFR2 and MET amplification before treatment and at progression on an FGFR inhibitor. D, Change in the tissue CN of FGFR2 and MET amplification before treatment and at progression on FGFR inhibitor. E, Hematoxylin and eosin–stained and IHC-stained images with anti-FGFR2 and MET antibodies of biopsy specimens of the primary gastric cancer before treatment and at progression on an FGFR inhibitor.