. 2021 Jun 4;27(15):4221–4229. doi: 10.1158/1078-0432.CCR-21-0417

Figure 1.

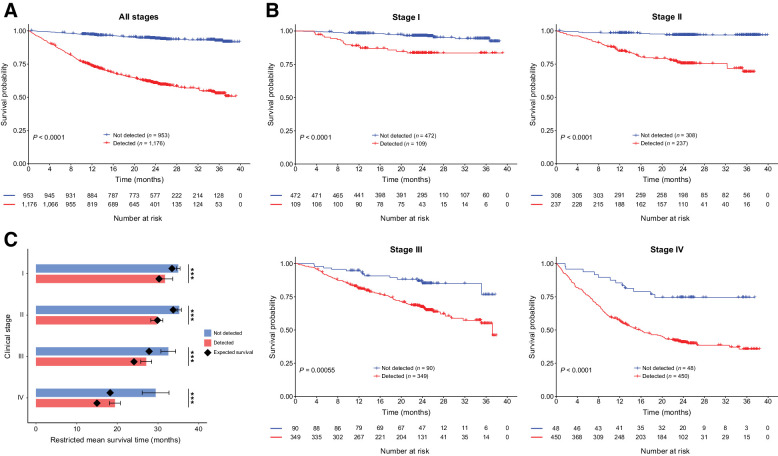
Figure 1. Comparison of OS in cancers detected versus not detected by the MCED test. A, Kaplan–Meier curve depicting OS for cancer participants of all stages detected (red) versus not detected (blue) by the MCED test. P value: log-rank test. B, Kaplan–Meier curve depicting OS for cancer participants of stages I–IV, detected (red) versus not detected (blue) by the MCED test. P values: log-rank test. C, Estimated RMST at 36 months for the MCED test detected and not detected cancers. Black diamonds indicate SEER-based expected survival. Error bars, 95% CI. ***, t test, P < 0.0001.

Comparison of OS in cancers detected versus not detected by the MCED test. A, Kaplan–Meier curve depicting OS for cancer participants of all stages detected (red) versus not detected (blue) by the MCED test. P value: log-rank test. B, Kaplan–Meier curve depicting OS for cancer participants of stages I–IV, detected (red) versus not detected (blue) by the MCED test. P values: log-rank test. C, Estimated RMST at 36 months for the MCED test detected and not detected cancers. Black diamonds indicate SEER-based expected survival. Error bars, 95% CI. ***, t test, P < 0.0001.