. 2021 Jun 4;27(15):4221–4229. doi: 10.1158/1078-0432.CCR-21-0417

Figure 5.

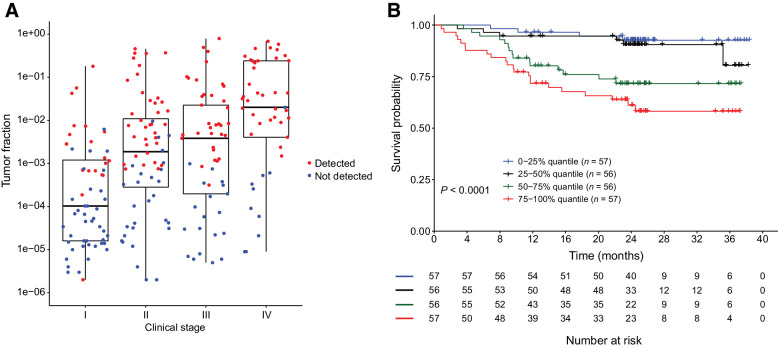
Figure 5. Association of tumor fraction in cfDNA and cancer aggressiveness. A, Box plot depicting clinical stage (x-axis) versus tumor fraction (y-axis). Cancers detected (red) or not detected (blue) by the MCED test are indicated. B, Comparison of OS in tumor fraction high and low cancers. Tumor fraction is divided into four quantiles, with 75%–100% being the highest quantile.

Association of tumor fraction in cfDNA and cancer aggressiveness. A, Box plot depicting clinical stage (x-axis) versus tumor fraction (y-axis). Cancers detected (red) or not detected (blue) by the MCED test are indicated. B, Comparison of OS in tumor fraction high and low cancers. Tumor fraction is divided into four quantiles, with 75%–100% being the highest quantile.