. 2021 Jun 22;27(19):5225–5235. doi: 10.1158/1078-0432.CCR-21-0809

Figure 1.

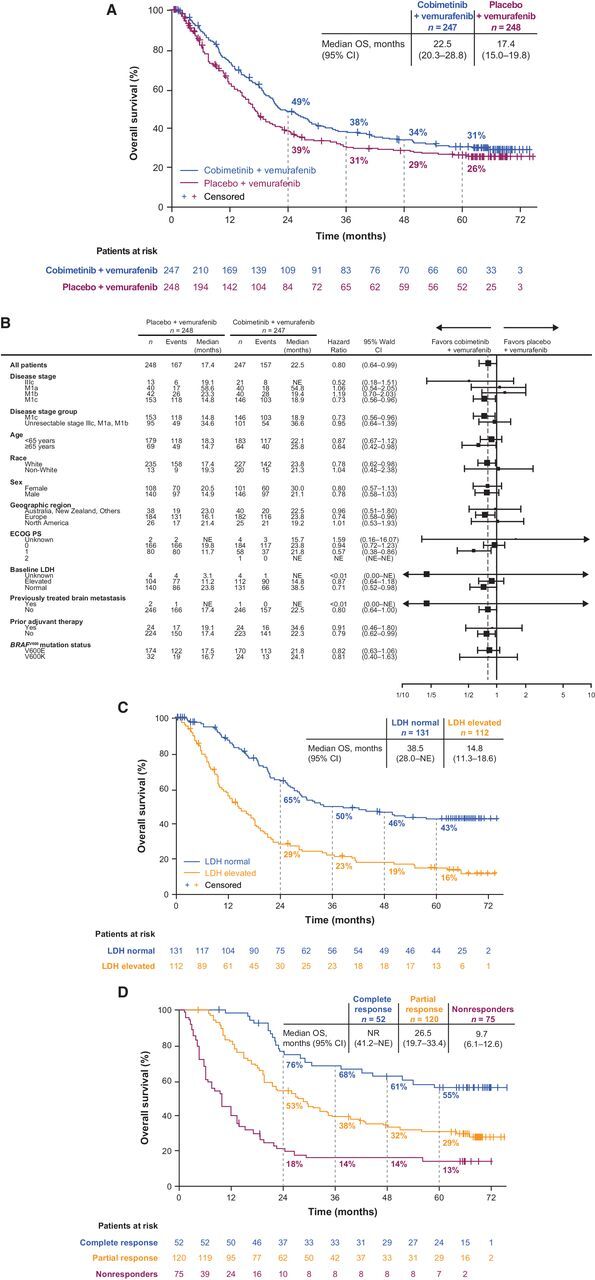
Figure 1. Overall survival. A, Kaplan–Meier curve of overall survival in the ITT population. B, Forest plot of hazard ratios for overall survival across patient subgroups. C, Overall survival in cobimetinib plus vemurafenib–treated patients with normal versus elevated LDH levels at baseline. D, Cobimetinib plus vemurafenib–treated patients who achieved complete response or partial response versus nonresponders.

Overall survival. A, Kaplan–Meier curve of overall survival in the ITT population. B, Forest plot of hazard ratios for overall survival across patient subgroups. C, Overall survival in cobimetinib plus vemurafenib–treated patients with normal versus elevated LDH levels at baseline. D, Cobimetinib plus vemurafenib–treated patients who achieved complete response or partial response versus nonresponders.