. 2021 Jun 22;27(19):5225–5235. doi: 10.1158/1078-0432.CCR-21-0809

Figure 2.

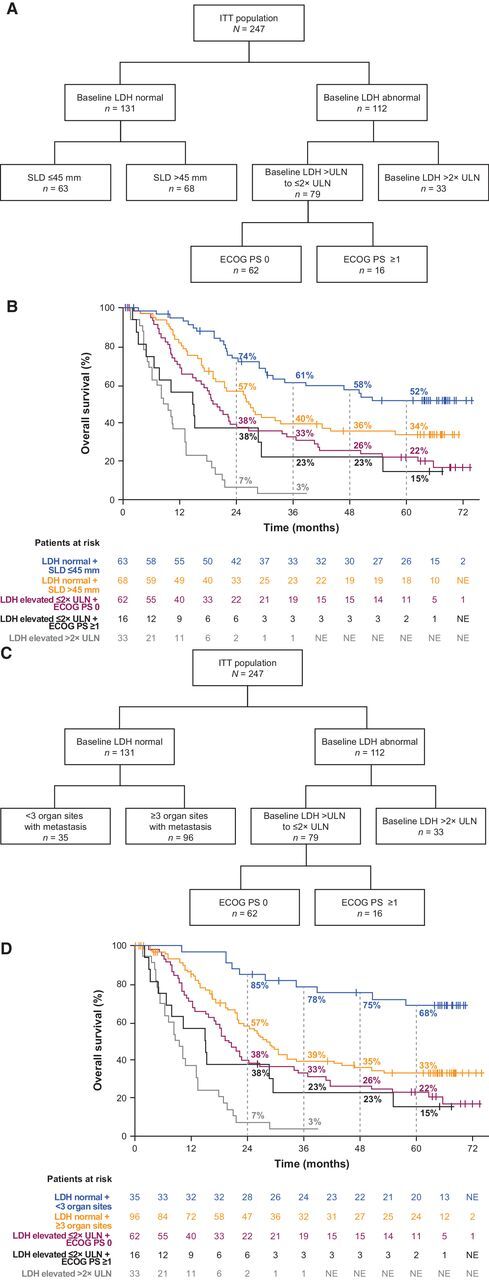
Figure 2. Overall survival outcomes by prognostic subgroups. A, Decision tree for prognostic subgroups identified by Hauschild et al. (10) in cobimetinib plus vemurafenib–treated patients. B, Kaplan–Meier curves of overall survival across prognostic subgroups identified by Hauschild et al. (10) in cobimetinib plus vemurafenib–treated patients. C, Decision tree for prognostic subgroups identified by Long et al. (11) in cobimetinib plus vemurafenib–treated patients. D, Kaplan–Meier curves of overall survival across prognostic subgroups identified by Long et al. (11) in cobimetinib plus vemurafenib–treated patients.

Overall survival outcomes by prognostic subgroups. A, Decision tree for prognostic subgroups identified by Hauschild et al. (10) in cobimetinib plus vemurafenib–treated patients. B, Kaplan–Meier curves of overall survival across prognostic subgroups identified by Hauschild et al. (10) in cobimetinib plus vemurafenib–treated patients. C, Decision tree for prognostic subgroups identified by Long et al. (11) in cobimetinib plus vemurafenib–treated patients. D, Kaplan–Meier curves of overall survival across prognostic subgroups identified by Long et al. (11) in cobimetinib plus vemurafenib–treated patients.