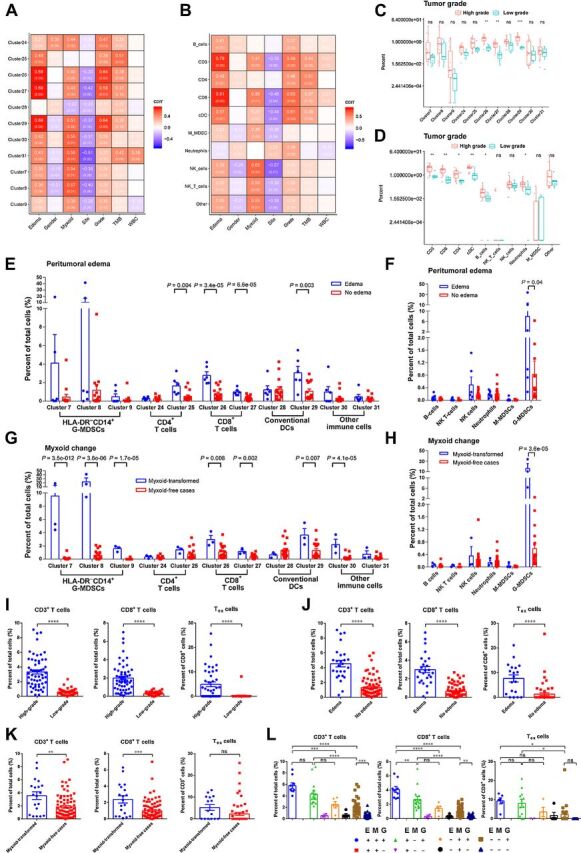
Figure 4.

The correlations between clinical features and immune cells. t-SNE plots from Fig. 1B were referenced by the data in this figure. A and B, Pearson correlation assays for associations between clinical features and immune-cell subgroups. Figures in red background indicated positive correlation, while figures in purple background represented negative correlation. Figures in brackets were P values. C and D, Comparisons of immune-cell proportions between high-grade and low-grade cases. Immune-cell subgroups were identified by CyTOF (C) and multicolor flow cytometry (D). Wilcoxon signed rank test was used to evaluate potential statistical difference between 2 groups. E and F, Comparisons of immune-cell proportions between cases with or without peritumoral edema. Wilcoxon signed rank test was used to evaluate potential statistical difference between 2 groups. G and H, Comparisons of immune-cell proportions between cases with or without myxoid change. High proportion of G-MDSCs were only found in myxoid-transformed cases. Wilcoxon signed rank test was utilized to assess potential statistical significance between groups. I–K, Comparison of CD3+ T cells, CD8+ T cells, and Tex cells between groups divided by tumor grade (I), peritumoral edema (J), and myxoid status (K). Tex cells were defined as PD-1+ TIM-3+ T cells in multicolor flow cytometry from 77 cases. The Student t test was used to compare the means of the groups. L, CHS cases were divided into 8 groups according to tumor grade, peritumoral edema, and myxoid status. Comparison of immune-cell proportions between groups was accomplished by one-way ANOVA with Holm–Sidak multiple comparisons test. E, edema condition; G, tumor grade; M, myxoid status; +, positive or high tumor grade; –, negative or low tumor grade. *, P < 0.05; **, P < 0.01; ***, P < 0.001; ****, P < 0.0001.
