. 2021 Dec 1;27(23):6500–6513. doi: 10.1158/1078-0432.CCR-21-1652

Figure 3.

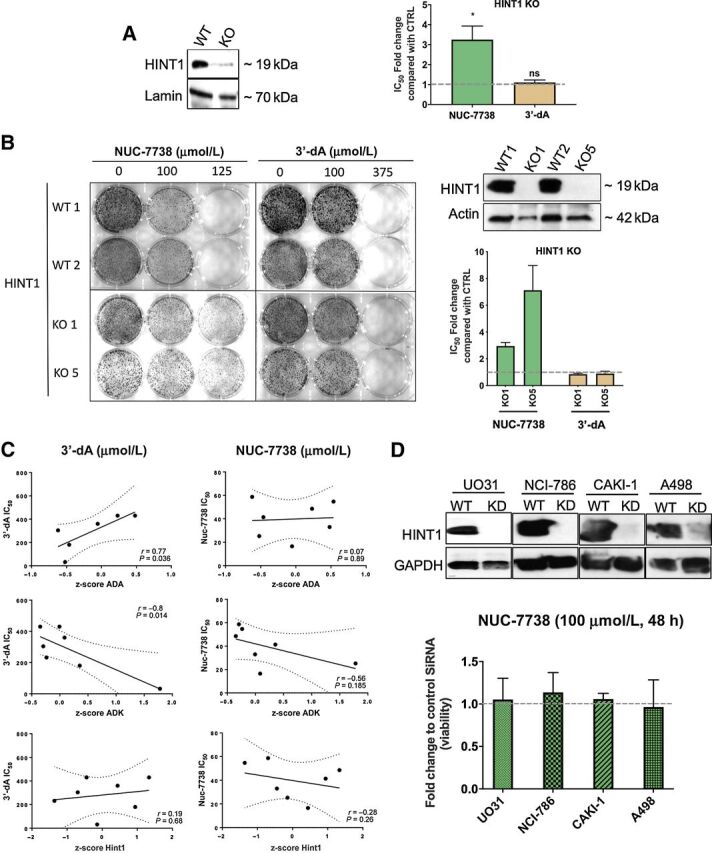
Figure 3. Validation of top hits from genome-wide haploid screen. A, HINT1 was deleted in HAP1 cells using CRISPR/Cas9 technology, as shown by Western blot analysis of HINT1 KO cells using specific antibodies to HINT1. WT and KO cells were treated with either NUC-7738 or 3′-dA. IC50 values were determined and the fold change between KO and WT cells was calculated. B, Single-cell–derived clonal knockouts for HINT1 (KO1 and KO5) and 2 WT isogenic cell lines. Western blot analysis of HINT1 KO cells using specific antibodies to HINT1 is shown. Following treatment with NUC-7738 or 3′-dA, IC50 values were determined and the fold change between KO and WT cells were calculated. C, Correlation between IC50 of NUC-7738 or 3′-dA and mRNA abundance in different NCI-60 cells is given for ADA, ADK, and HINT1. mRNA expression levels are given as z-score calculated across all NCI-60 cell lines. mRNA expression levels were obtained from CellMinerTM v2.4.2. D, Western blot validation of siRNA-mediated HINT1 knockdown in renal cancer cell lines. WT and knockdown cells were treated with either NUC-7738 or 3′-dA. Graph shows the fold change in percentage of viable cells normalized to control (n = 3) after treatment with NUC-7738.

Validation of top hits from genome-wide haploid screen. A, HINT1 was deleted in HAP1 cells using CRISPR/Cas9 technology, as shown by Western blot analysis of HINT1 KO cells using specific antibodies to HINT1. WT and KO cells were treated with either NUC-7738 or 3′-dA. IC50 values were determined and the fold change between KO and WT cells was calculated. B, Single-cell–derived clonal knockouts for HINT1 (KO1 and KO5) and 2 WT isogenic cell lines. Western blot analysis of HINT1 KO cells using specific antibodies to HINT1 is shown. Following treatment with NUC-7738 or 3′-dA, IC50 values were determined and the fold change between KO and WT cells were calculated. C, Correlation between IC50 of NUC-7738 or 3′-dA and mRNA abundance in different NCI-60 cells is given for ADA, ADK, and HINT1. mRNA expression levels are given as z-score calculated across all NCI-60 cell lines. mRNA expression levels were obtained from CellMinerTM v2.4.2. D, Western blot validation of siRNA-mediated HINT1 knockdown in renal cancer cell lines. WT and knockdown cells were treated with either NUC-7738 or 3′-dA. Graph shows the fold change in percentage of viable cells normalized to control (n = 3) after treatment with NUC-7738.