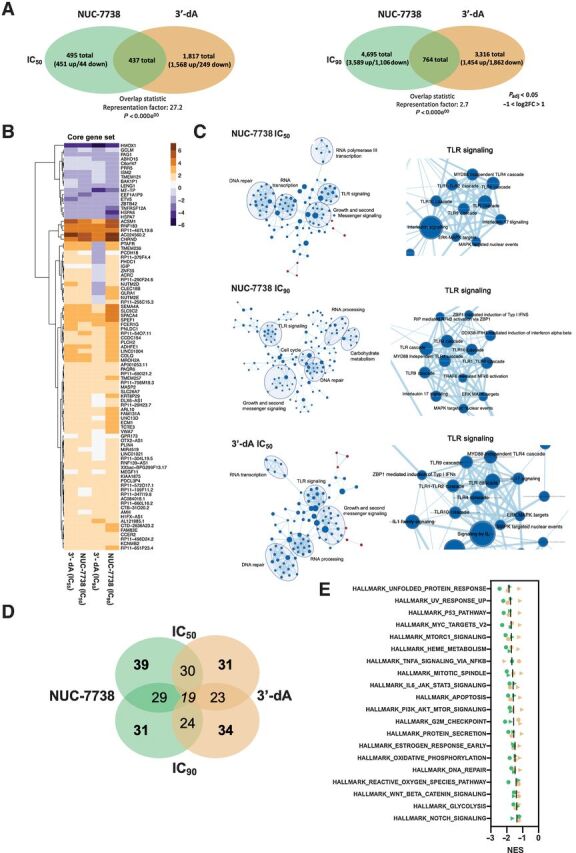
Figure 4.

Transcription profiling of HAP1 cells treated with 3′-dA and NUC-7738. A, Venn diagram summarizing the number of differentially expressed genes (Padj < 0.05 and −2>FC>2) in 3′-dA and NUC-7738–treated samples. B, Expression heatmap of 91 genes commonly differentially expressed in all 4 tested conditions (Padj < 0.05 and −2>FC>2). GSEA and network mapping using Cytoscape. Genes ranked according to their P value and GSEA were performed on REACTOME gene sets. Gene overlaps between different pathways are shown. Nodes are GSEA enriched pathways while Edges represent overlapping shared genes between two pathways. C, GSEA and network mapping using Cytoscape. Genes ranked according to their P value and GSEA was performed on REACTOME gene sets. Gene overlaps between different pathways are shown. Nodes are GSEA enriched pathways while Edges represent overlapping shared genes between two pathways. D, Venn diagram summarizing number of overlapping enriched pathways by GSEA using Molecular Signature Database collection of HALLMARK gene. E, Summary of top 20 enriched pathways for Hallmark set enrichment analysis of hits for NUC-7738 and 3′-dA–treated cells. Green and orange indicate NUC-7738 and 3′-dA, respectively. Circles and triangles indicate dosing at IC50 and IC90, respectively.
