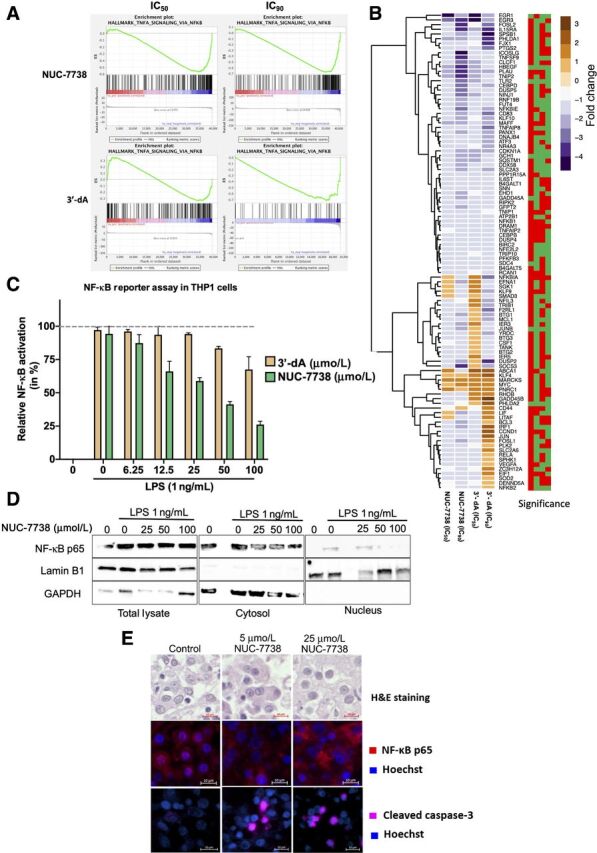
Figure 5.

NUC-7738 and 3′-dA affect the NF-κB pathway. A, Enrichment plots for NF-κB pathway for all 4 conditions. ES, Enrichment score. B, Expression levels of genes found in the leading edge of NF-κB pathway enrichment. Blue indicates downregulation and brown indicates upregulation of transcript. Significance plot indicates whether the gene was significantly differentially expressed. Red stands for Padj > 0.05 and green Padj < 0.05. Order of columns corresponds with expression heatmap. C, NF-κB activity was measured using the SEAP reporter gene assay in THP-1 cells. NF-κB activity was induced with lipopolysaccharide (LPS) in the presence or absence of NUC-7738. SEAP production as result of NF-κB activity was measured using the QuantiBlue colorimetric enzyme assay. Values were normalized to untreated LPS stimulated cells. D, NF-κB activity was induced with LPS in the presence or absence of NUC-7738 in NF-κB THP1 reporter cell line. Cells were harvested and fractionated into nuclear and cytosolic fraction. Western blot analysis using specific antibodies was employed to detect NF-κB p65 (RELA), nuclear marker Lamin B1, and cytosolic marker GAPDH. E, NF-κB p65 and Caspase 3 in ex vivo tissue treated with NUC-7738 for 24 hours. NF-κB p65 was seen in the nucleus of controls but disappeared after treatment with NUC-7738, and an increase in Caspase 3 was observed after 24 hours. H&E, Hematoxylin and eosin.
