. 2021 Jul 29;27(20):5502–5509. doi: 10.1158/1078-0432.CCR-21-0761

Figure 3.

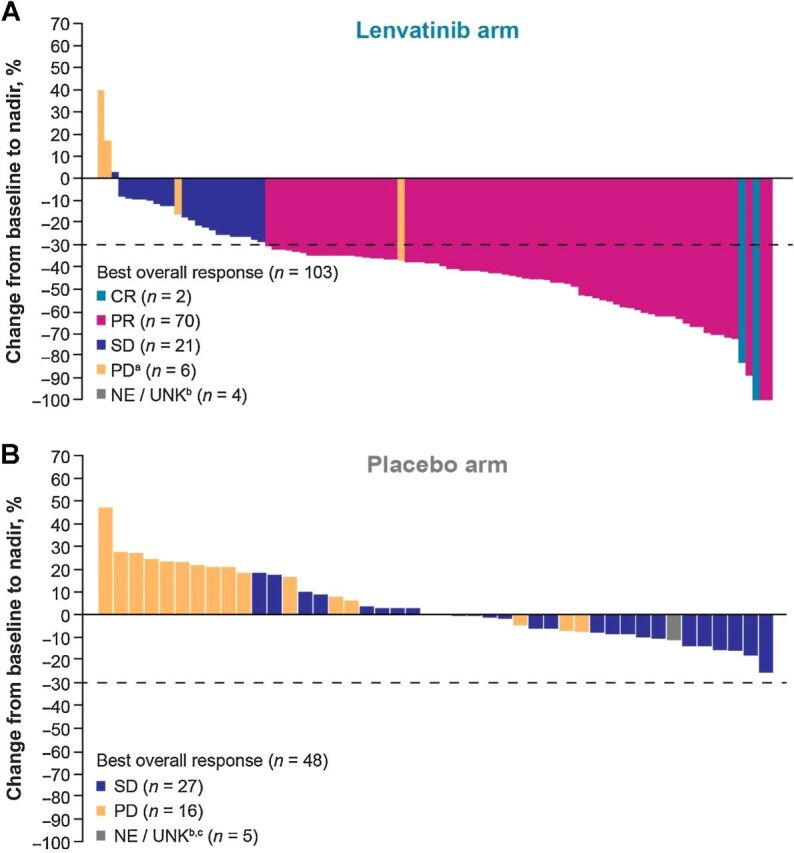
Figure 3. Percentage changes in the sums of diameters of target lesions from baseline to postbaseline nadir for patients treated with (A) lenvatinib or (B) placebo (by IIR using RECIST v1.1). CR, complete response; IIR, independent imaging review; NE/UNK, not evaluable/unknown; PD, progressive disease; PR, partial response; RECIST v1.1, Response Evaluation Criteria In Solid Tumors version 1.1; SD, stable disease. aTwo patients were determined to be PD due to nontarget lesions, but target lesions were not evaluable. These patients are not depicted on the plot. b“Unknown” patients lacked a baseline and/or postbaseline tumor assessment. c1 patient had a single postbaseline assessment at week 5 but this duration was not long enough to be considered SD. This patient is considered “NE” and is shown in gray in this plot.

Percentage changes in the sums of diameters of target lesions from baseline to postbaseline nadir for patients treated with (A) lenvatinib or (B) placebo (by IIR using RECIST v1.1). CR, complete response; IIR, independent imaging review; NE/UNK, not evaluable/unknown; PD, progressive disease; PR, partial response; RECIST v1.1, Response Evaluation Criteria In Solid Tumors version 1.1; SD, stable disease. aTwo patients were determined to be PD due to nontarget lesions, but target lesions were not evaluable. These patients are not depicted on the plot. b“Unknown” patients lacked a baseline and/or postbaseline tumor assessment. c1 patient had a single postbaseline assessment at week 5 but this duration was not long enough to be considered SD. This patient is considered “NE” and is shown in gray in this plot.