. 2021 Jun 9;27(17):4848–4858. doi: 10.1158/1078-0432.CCR-20-4219

Figure 2.

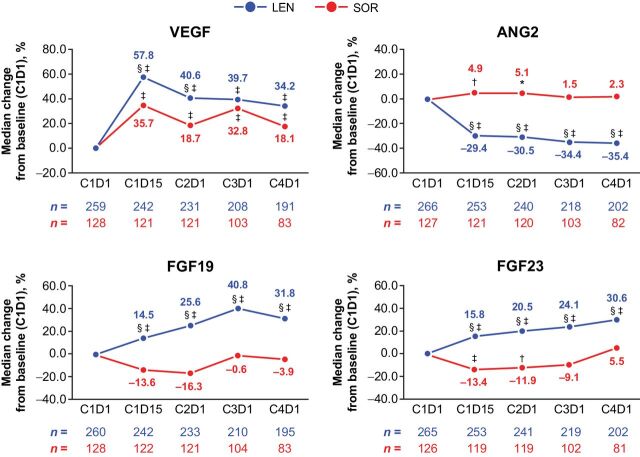
Figure 2. Percentage changes in levels of serum biomarkers from baseline. *, P < 0.05 vs. baseline; †, P < 0.01 vs. baseline; ‡, P < 0.0001 vs. baseline; §, P < 0.05 between the LEN and SOR arms. ANG2, angiopoietin-2; C, cycle; D, day; FGF, fibroblast growth factor; LEN, lenvatinib; SOR, sorafenib; VEGF, vascular endothelial growth factor.

Percentage changes in levels of serum biomarkers from baseline. *, P < 0.05 vs. baseline; †, P < 0.01 vs. baseline; ‡, P < 0.0001 vs. baseline; §, P < 0.05 between the LEN and SOR arms. ANG2, angiopoietin-2; C, cycle; D, day; FGF, fibroblast growth factor; LEN, lenvatinib; SOR, sorafenib; VEGF, vascular endothelial growth factor.