. 2021 Jun 3;27(15):4397–4409. doi: 10.1158/1078-0432.CCR-20-5026

Figure 2.

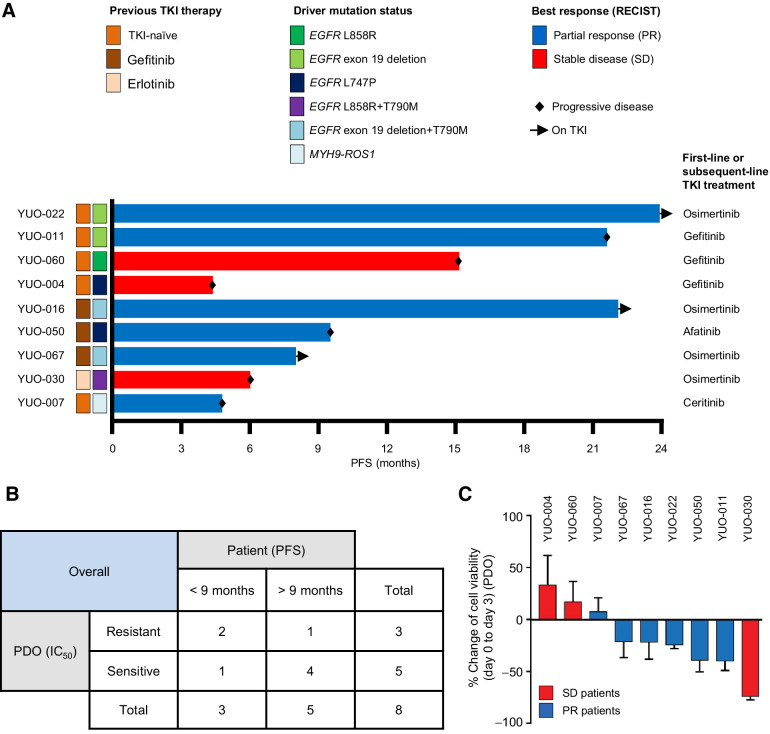
Figure 2. Advanced lung adenocarcinoma organoids can predict patient treatment responses to a TKI monotherapy. A, Swimmers' plot showing clinical annotations of 9 patients with NSCLC who received subsequent TKI therapy after their tumor specimens were obtained to generate organoids. Each bar represents an individual patient. Subsequent TKI therapy each patient received is indicated on the right. B, Supplementary Table summarizing correlations between clinical responses (PFS) in patients and in vitro responses (mean IC50 value from three independent experiments at 3 days) in matching PDOs. C, Bar graphs showing percentage change of cell viability in PDOs after exposure to each TKI at 100 nmol/L for 3 days. Bar colors represent each patient whose best response was stable disease (red) or partial response (blue) to the TKI. Data are presented as the mean ± SEM (n = 3). PR, partial response; SD, stable disease. See also Supplementary Table S2.

Advanced lung adenocarcinoma organoids can predict patient treatment responses to a TKI monotherapy. A, Swimmers' plot showing clinical annotations of 9 patients with NSCLC who received subsequent TKI therapy after their tumor specimens were obtained to generate organoids. Each bar represents an individual patient. Subsequent TKI therapy each patient received is indicated on the right. B, Supplementary Table summarizing correlations between clinical responses (PFS) in patients and in vitro responses (mean IC50 value from three independent experiments at 3 days) in matching PDOs. C, Bar graphs showing percentage change of cell viability in PDOs after exposure to each TKI at 100 nmol/L for 3 days. Bar colors represent each patient whose best response was stable disease (red) or partial response (blue) to the TKI. Data are presented as the mean ± SEM (n = 3). PR, partial response; SD, stable disease. See also Supplementary Table S2.