. 2021 Jun 3;27(15):4397–4409. doi: 10.1158/1078-0432.CCR-20-5026

Figure 6.

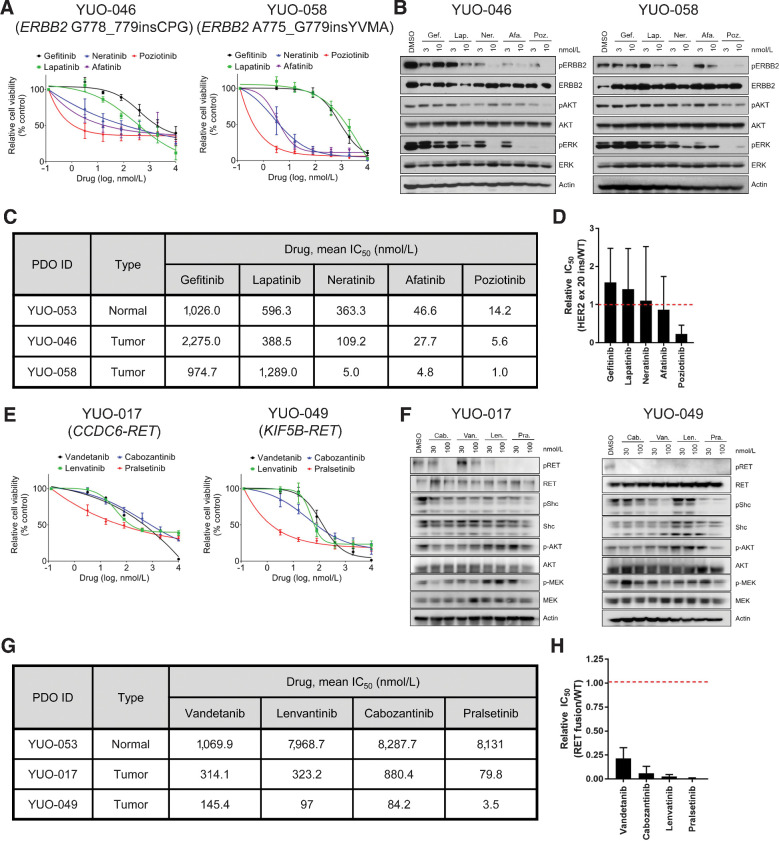
Figure 6. PDOs can identify effective therapies for advanced lung adenocarcinoma harboring ERBB2 exon 20 insertions or RET rearrangements. A, YUO-046 and YUO-058 harboring ERBB2 exon 20 insertions were treated with the indicated concentrations of gefitinib, lapatinib, neratinib, afatinib, and poziotinib for 5 days. B, Representative immunoblots of indicated molecules in YUO-046 and YUO-058 treated with the indicated concentrations of gefitinib, lapatinib, neratinib, afatinib, and poziotinib for 6 hours. C, IC50 values of gefitinib, lapatinib, neratinib, afatinib, and poziotinib in YUO-053, a normal-like organoid, and tumor organoids harboring ERBB2 exon 20 insertions. D, Bar graphs showing mean relative IC50 values of the ERBB2 inhibitors in ERBB2-mutant organoids to the normal organoid. E, YUO-017 and YUO-049 harboring RET fusions were treated with the indicated concentrations of vandetanib, lenvatinib, cabozantinib, and pralsetinib for 5 days. F, Representative immunoblots of indicated molecules in YUO-017 and YUO-049 treated with the indicated concentrations of cabozantinib, pralsetinib, vandetanib, and lenvatinib for 2 hours. G, IC50 values of vandetanib, lenvatinib, cabozantinib, and pralsetinib in a normal-like organoid and tumor organoids harboring RET rearrangements. H, Bar graphs showing mean relative IC50 values of the RET inhibitors in RET fusion positive organoids to the normal organoid. In A and E, data are presented as the mean ± SEM (n = 3). In C and G, mean IC50 values were calculated from three biological replicates (three technical replicates per independent experiment) using GraphPad Prism. In D and H, data are presented as the mean ± SD (n = 2).

PDOs can identify effective therapies for advanced lung adenocarcinoma harboring ERBB2 exon 20 insertions or RET rearrangements. A, YUO-046 and YUO-058 harboring ERBB2 exon 20 insertions were treated with the indicated concentrations of gefitinib, lapatinib, neratinib, afatinib, and poziotinib for 5 days. B, Representative immunoblots of indicated molecules in YUO-046 and YUO-058 treated with the indicated concentrations of gefitinib, lapatinib, neratinib, afatinib, and poziotinib for 6 hours. C, IC50 values of gefitinib, lapatinib, neratinib, afatinib, and poziotinib in YUO-053, a normal-like organoid, and tumor organoids harboring ERBB2 exon 20 insertions. D, Bar graphs showing mean relative IC50 values of the ERBB2 inhibitors in ERBB2-mutant organoids to the normal organoid. E, YUO-017 and YUO-049 harboring RET fusions were treated with the indicated concentrations of vandetanib, lenvatinib, cabozantinib, and pralsetinib for 5 days. F, Representative immunoblots of indicated molecules in YUO-017 and YUO-049 treated with the indicated concentrations of cabozantinib, pralsetinib, vandetanib, and lenvatinib for 2 hours. G, IC50 values of vandetanib, lenvatinib, cabozantinib, and pralsetinib in a normal-like organoid and tumor organoids harboring RET rearrangements. H, Bar graphs showing mean relative IC50 values of the RET inhibitors in RET fusion positive organoids to the normal organoid. In A and E, data are presented as the mean ± SEM (n = 3). In C and G, mean IC50 values were calculated from three biological replicates (three technical replicates per independent experiment) using GraphPad Prism. In D and H, data are presented as the mean ± SD (n = 2).