. 2021 Sep 3;12(1):108–133. doi: 10.1158/2159-8290.CD-21-0003

Figure 1.

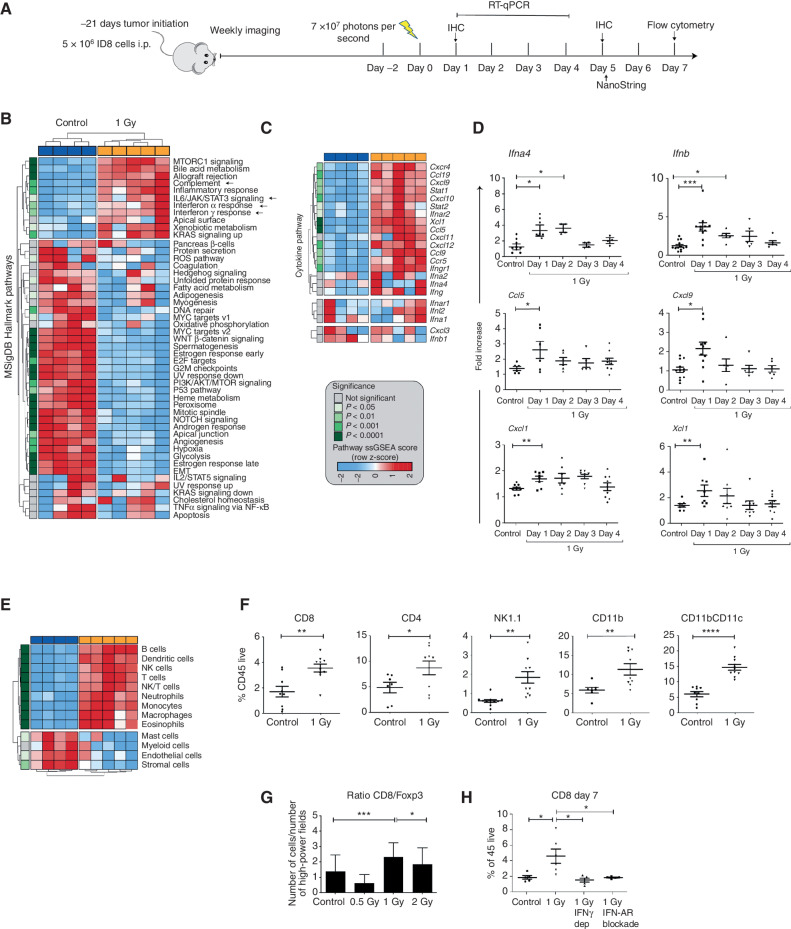
Figure 1. LDRT induces immune-cell infiltration in orthotopic ID8 tumors. A, Treatment schema of mice engrafted with intraperitoneal ID8 ovarian tumors. Arrow represents administration of LD-WART (1 Gy). B and C, NanoString analysis of LD-WART treated versus control tumors. MSigDB pathways (B) and intratumoral levels of cytokines and chemokines (C) are displayed as heat maps. Red, upregulated; blue, downregulated. D, mRNA levels of intratumoral cytokines and chemokines. E, Heat map of cell density changes in tumors based on NanoString analysis. The heat map legend applies to B, C, and E. F, Flow cytometry quantification of TILs. G, CD8+:Foxp3+ cell ratio by mIF imaging five days after LD-WART. H, Flow cytometry quantification of CD8+ TILs in control mice and mice subjected to IFNα receptor blockade or IFNγ depletion. Symbols represent individual tumors and bars the mean. Data are representative of three independent experiments and are presented as mean ± SEM. *, P ≤ 0.05; **, P < 0.01; ***, P < 0.001; ****, P < 0.0001; Student unpaired t test.

LDRT induces immune-cell infiltration in orthotopic ID8 tumors. A, Treatment schema of mice engrafted with intraperitoneal ID8 ovarian tumors. Arrow represents administration of LD-WART (1 Gy). B and C, NanoString analysis of LD-WART treated versus control tumors. MSigDB pathways (B) and intratumoral levels of cytokines and chemokines (C) are displayed as heat maps. Red, upregulated; blue, downregulated. D, mRNA levels of intratumoral cytokines and chemokines. E, Heat map of cell density changes in tumors based on NanoString analysis. The heat map legend applies to B, C, and E. F, Flow cytometry quantification of TILs. G, CD8+:Foxp3+ cell ratio by mIF imaging five days after LD-WART. H, Flow cytometry quantification of CD8+ TILs in control mice and mice subjected to IFNα receptor blockade or IFNγ depletion. Symbols represent individual tumors and bars the mean. Data are representative of three independent experiments and are presented as mean ± SEM. *, P ≤ 0.05; **, P < 0.01; ***, P < 0.001; ****, P < 0.0001; Student unpaired t test.