. 2021 Sep 3;12(1):108–133. doi: 10.1158/2159-8290.CD-21-0003

Figure 4.

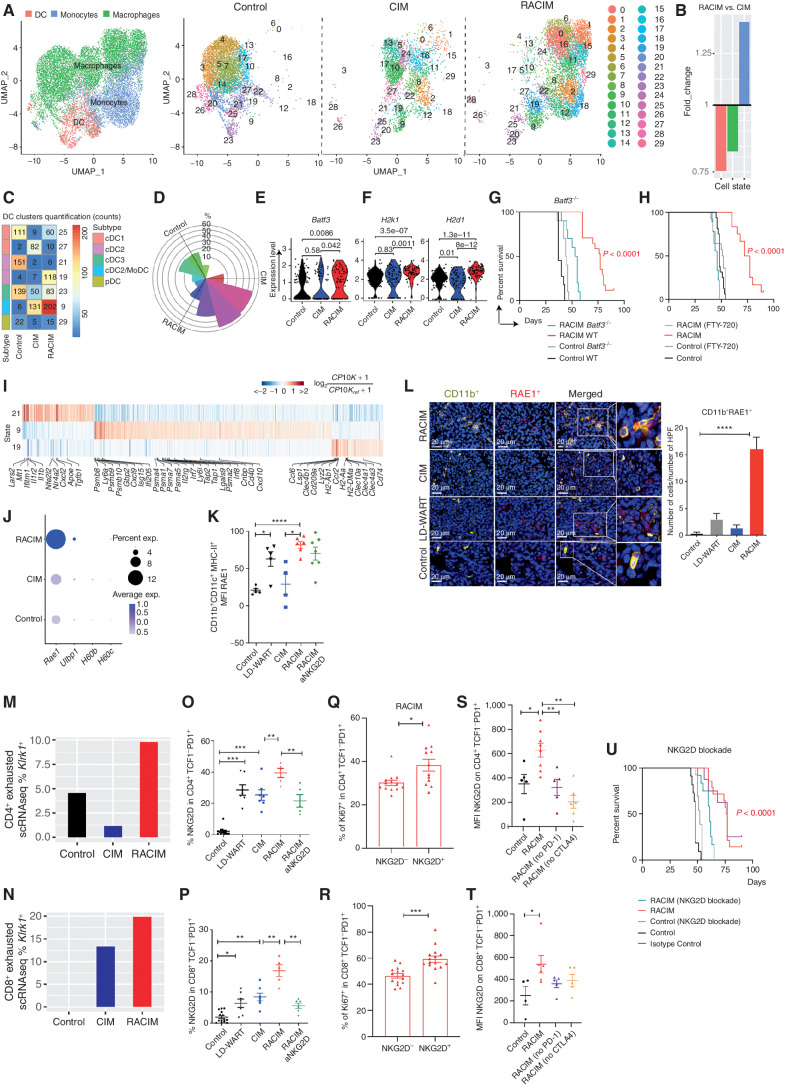
Figure 4. RACIM reprograms tumor APCs and enlists NKG2D as a key signal. A, UMAP plots of intratumoral myeloid cell scRNA-seq data (n = 3 tumors/treatment, n = 4 tumors pooled for control, all collected on day 5 of cycle 2). Left, reference map for all groups. Red, DCs; blue, monocytes; green, macrophages. Right, 29 myeloid states among groups. B, Fold change in myeloid cell subsets for RACIM versus CIM. C, Quantification of DC clusters among groups. D, Rose plot of differentially expressed genes corresponding to DC clusters among groups. E and F, Violin plots showing expression of Batf3 (E) and H2k1 and H2d1 (MHC-I; F) transcripts in cDC1 cells among groups. G and H, Kaplan–Meier analysis of control versus RACIM in Batf3−/− mice (G), and in wild-type (WT) mice (H) in the presence of fingolimod (FTY-720) treatment. P values were determined by a one-sided log-rank Mantel–Cox test. I, Heat map showing expression of the most representative genes for clusters 9, 19, and 21. Gene expression was normalized to median expression value per gene across all clusters shown in the heat map. J, Percentage of cells expressing Rae1, Ulbp1, H60b, and H60c, and average expression in the myeloid compartment by scRNA-seq (size of dot indicates the percentage of cells in each subset; expression level is indicated by color). K, RAE1 expression on intratumoral CD11b+CD11c+MHC-II+ cells determined by flow-cytometric analysis on day 5 of cycle 2. L, Left, mIF imaging reveals RAE1 expression (red) by CD11b+ cells (yellow; 20× magnification; DAPI nuclear counterstaining; representative of n = 5 mice/group). Right, number of CD11b+RAE+ cells per HPF plotted as mean ± SD; P was calculated using unpaired two-tailed Student t tests. M and N, The percentage of CD4+ and CD8+ exhausted T cells expressing NKG2D at the transcriptional (M and N, Klrk1 gene by scRNA-seq analysis) and protein levels (O and P, flow cytometry analysis) on day 5 of cycle 2. Q and R, The percentage of intratumoral Ki-67+proliferating CD4+TCF1+PD-1+ (Q) and CD8+TCF1−PD-1+ (R) cells upon RACIM on day 5 of cycle 2. S–T, NKG2D expression on intratumoral CD4+TCF1−PD-1+ (S) and CD8+TCF1−PD1+ (T) T cells determined by flow cytometry on day 5 of cycle 2 in control or RACIM or RACIM without ICB-treated tumors. U, RACIM survival with NKG2D blockade. P values were determined by a one-sided log-rank Mantel–Cox test. Data are representative of two to three independent experiments (n = 5–10 mice/group). Unless otherwise indicated, statistical analysis was performed using Student unpaired t test; error bars represent mean ± standard deviation. *, P ≤ 0.05; **, P < 0.01; ***, P < 0.001; ****, P < 0.0001.

RACIM reprograms tumor APCs and enlists NKG2D as a key signal. A, UMAP plots of intratumoral myeloid cell scRNA-seq data (n = 3 tumors/treatment, n = 4 tumors pooled for control, all collected on day 5 of cycle 2). Left, reference map for all groups. Red, DCs; blue, monocytes; green, macrophages. Right, 29 myeloid states among groups. B, Fold change in myeloid cell subsets for RACIM versus CIM. C, Quantification of DC clusters among groups. D, Rose plot of differentially expressed genes corresponding to DC clusters among groups. E and F, Violin plots showing expression of Batf3 (E) and H2k1 and H2d1 (MHC-I; F) transcripts in cDC1 cells among groups. G and H, Kaplan–Meier analysis of control versus RACIM in Batf3−/− mice (G), and in wild-type (WT) mice (H) in the presence of fingolimod (FTY-720) treatment. P values were determined by a one-sided log-rank Mantel–Cox test. I, Heat map showing expression of the most representative genes for clusters 9, 19, and 21. Gene expression was normalized to median expression value per gene across all clusters shown in the heat map. J, Percentage of cells expressing Rae1, Ulbp1, H60b, and H60c, and average expression in the myeloid compartment by scRNA-seq (size of dot indicates the percentage of cells in each subset; expression level is indicated by color). K, RAE1 expression on intratumoral CD11b+CD11c+MHC-II+ cells determined by flow-cytometric analysis on day 5 of cycle 2. L, Left, mIF imaging reveals RAE1 expression (red) by CD11b+ cells (yellow; 20× magnification; DAPI nuclear counterstaining; representative of n = 5 mice/group). Right, number of CD11b+RAE+ cells per HPF plotted as mean ± SD; P was calculated using unpaired two-tailed Student t tests. M and N, The percentage of CD4+ and CD8+ exhausted T cells expressing NKG2D at the transcriptional (M and N, Klrk1 gene by scRNA-seq analysis) and protein levels (O and P, flow cytometry analysis) on day 5 of cycle 2. Q and R, The percentage of intratumoral Ki-67+proliferating CD4+TCF1+PD-1+ (Q) and CD8+TCF1PD-1+ (R) cells upon RACIM on day 5 of cycle 2. S–T, NKG2D expression on intratumoral CD4+TCF1PD-1+ (S) and CD8+TCF1PD1+ (T) T cells determined by flow cytometry on day 5 of cycle 2 in control or RACIM or RACIM without ICB-treated tumors. U, RACIM survival with NKG2D blockade. P values were determined by a one-sided log-rank Mantel–Cox test. Data are representative of two to three independent experiments (n = 5–10 mice/group). Unless otherwise indicated, statistical analysis was performed using Student unpaired t test; error bars represent mean ± standard deviation. *, P ≤ 0.05; **, P < 0.01; ***, P < 0.001; ****, P < 0.0001.