. 2021 Sep 3;12(1):108–133. doi: 10.1158/2159-8290.CD-21-0003

Figure 6.

Figure 6. Effect of low-dose irradiation on tumor immune landscape. A, TILs before and after LDRT revealed by mIF imaging in two representative responding tumors. Left, representative mIF images (20× magnification; CK, pancytokeratin); right, quantification of CD4+ and CD8+ cells. B, Scatter plot showing differential gene expression between baseline and post-irradiation biopsy in responding (x-axis) versus nonresponding tumors (y-axis). The log2 of the fold change in median gene expression (log2FC) is shown (positive values indicate upregulation post-LDRT). Genes displaying a significant change (unadjusted P < 0.05) are color-coded as shown in the legend. C, Line plots showing the progression of immune gene signature scores from baseline to post-LDRT biopsies in responding versus nonresponding tumors. D, Scatter plot showing differential immune signature score analysis between baseline and post-irradiation biopsy in responding human tumors (x-axis) versus responding mouse (RACIM) ID8 tumors (y-axis; top) and between nonresponding human versus nonresponding (CIM) mouse tumors (bottom). E, NanoString GeoMx analysis of intraepithelial tumor immune infiltrates vs. tumor stroma immune infiltrates in responding versus nonresponding tumors. The log2 of the fold change in the median of the signature score (log2FC) is shown. Immune signature score displaying a significant change (unadjusted P < 0.05) is color-coded as depicted in the legend of B. F, Comparison of TCR CDR3 diversity by clonality, Shannon diversity entropy, Gini coefficient, richness, and shared frequency in three patients with responding tumors.

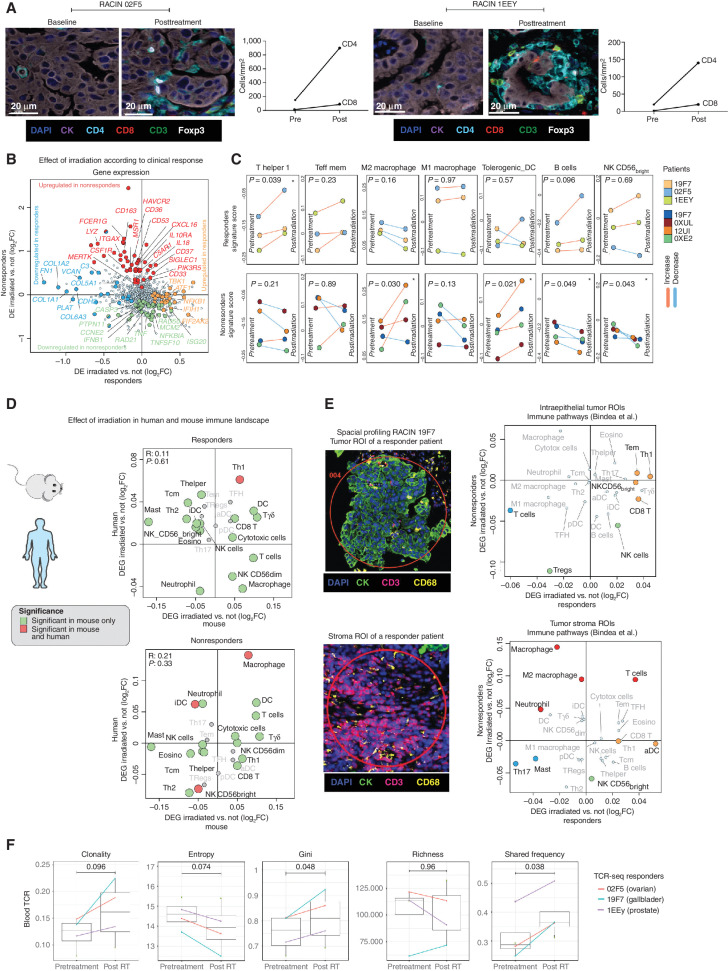
Effect of low-dose irradiation on tumor immune landscape. A, TILs before and after LDRT revealed by mIF imaging in two representative responding tumors. Left, representative mIF images (20× magnification; CK, pancytokeratin); right, quantification of CD4+ and CD8+ cells. B, Scatter plot showing differential gene expression between baseline and post-irradiation biopsy in responding (x-axis) versus nonresponding tumors (y-axis). The log2 of the fold change in median gene expression (log2FC) is shown (positive values indicate upregulation post-LDRT). Genes displaying a significant change (unadjusted P < 0.05) are color-coded as shown in the legend. C, Line plots showing the progression of immune gene signature scores from baseline to post-LDRT biopsies in responding versus nonresponding tumors. D, Scatter plot showing differential immune signature score analysis between baseline and post-irradiation biopsy in responding human tumors (x-axis) versus responding mouse (RACIM) ID8 tumors (y-axis; top) and between nonresponding human versus nonresponding (CIM) mouse tumors (bottom). E, NanoString GeoMx analysis of intraepithelial tumor immune infiltrates vs. tumor stroma immune infiltrates in responding versus nonresponding tumors. The log2 of the fold change in the median of the signature score (log2FC) is shown. Immune signature score displaying a significant change (unadjusted P < 0.05) is color-coded as depicted in the legend of B. F, Comparison of TCR CDR3 diversity by clonality, Shannon diversity entropy, Gini coefficient, richness, and shared frequency in three patients with responding tumors.