. 2021 Sep 15;27(23):6323–6332. doi: 10.1158/1078-0432.CCR-21-1704

Figure 1.

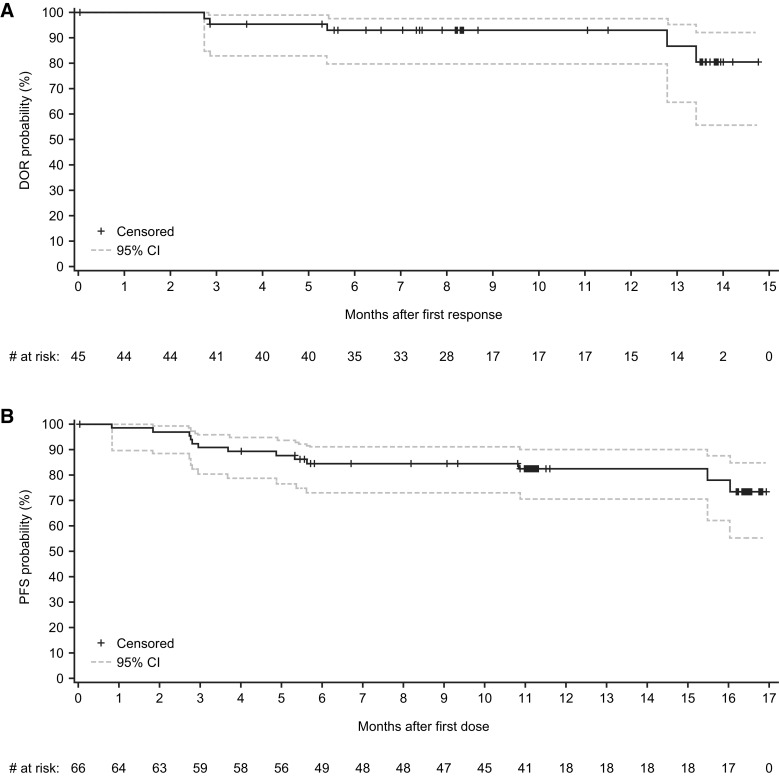
Figure 1. A, Kaplan–Meier plot of duration of response with zanubrutinib per IRC assessment based on Lugano classification (15) for patients with MZL in the MAGNOLIA study (BGB-3111–214). Only patients with either PR or CR were included. B, Kaplan–Meier plot of PFS with zanubrutinib per IRC assessment based on Lugano classification (15) for patients with MZL in the MAGNOLIA study (BGB-3111–214). CIs were calculated using a generalized Brookmeyer and Crowley method.

A, Kaplan–Meier plot of duration of response with zanubrutinib per IRC assessment based on Lugano classification (15) for patients with MZL in the MAGNOLIA study (BGB-3111–214). Only patients with either PR or CR were included. B, Kaplan–Meier plot of PFS with zanubrutinib per IRC assessment based on Lugano classification (15) for patients with MZL in the MAGNOLIA study (BGB-3111–214). CIs were calculated using a generalized Brookmeyer and Crowley method.