. 2021 Oct 19;28(3):468–478. doi: 10.1158/1078-0432.CCR-21-2635

Figure 1.

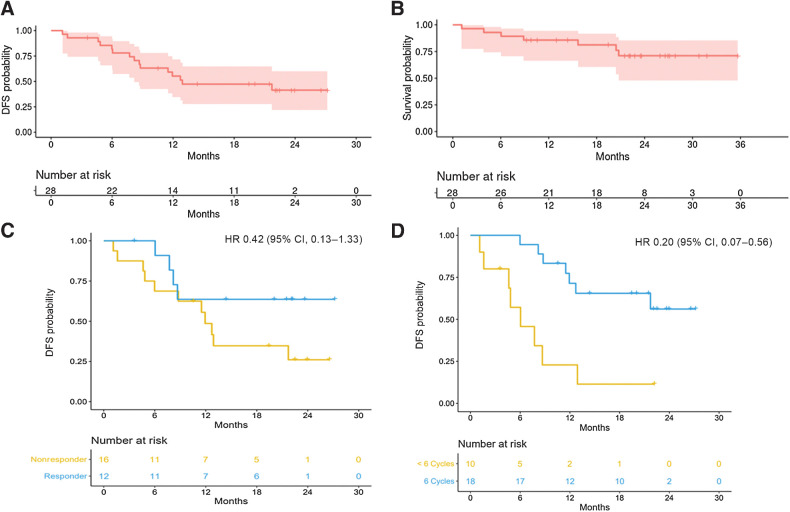
Figure 1. Kaplan–Meier curves showing (A) DFS reported in months from the time of salvage surgery to the first of any disease recurrence, death, or censored at last follow-up. B, OS reported in months from the time of salvage surgery to death from any cause, or censored at last follow-up. DFS stratified by (C) pathologic response (PPR = partial pathologic response, ≤50% tumor viability; MPR = major pathologic response, ≤10% tumor viability) and (D) number of adjuvant cycles of immunotherapy received (maximum of 6).

Kaplan–Meier curves showing (A) DFS reported in months from the time of salvage surgery to the first of any disease recurrence, death, or censored at last follow-up. B, OS reported in months from the time of salvage surgery to death from any cause, or censored at last follow-up. DFS stratified by (C) pathologic response (PPR = partial pathologic response, ≤50% tumor viability; MPR = major pathologic response, ≤10% tumor viability) and (D) number of adjuvant cycles of immunotherapy received (maximum of 6).