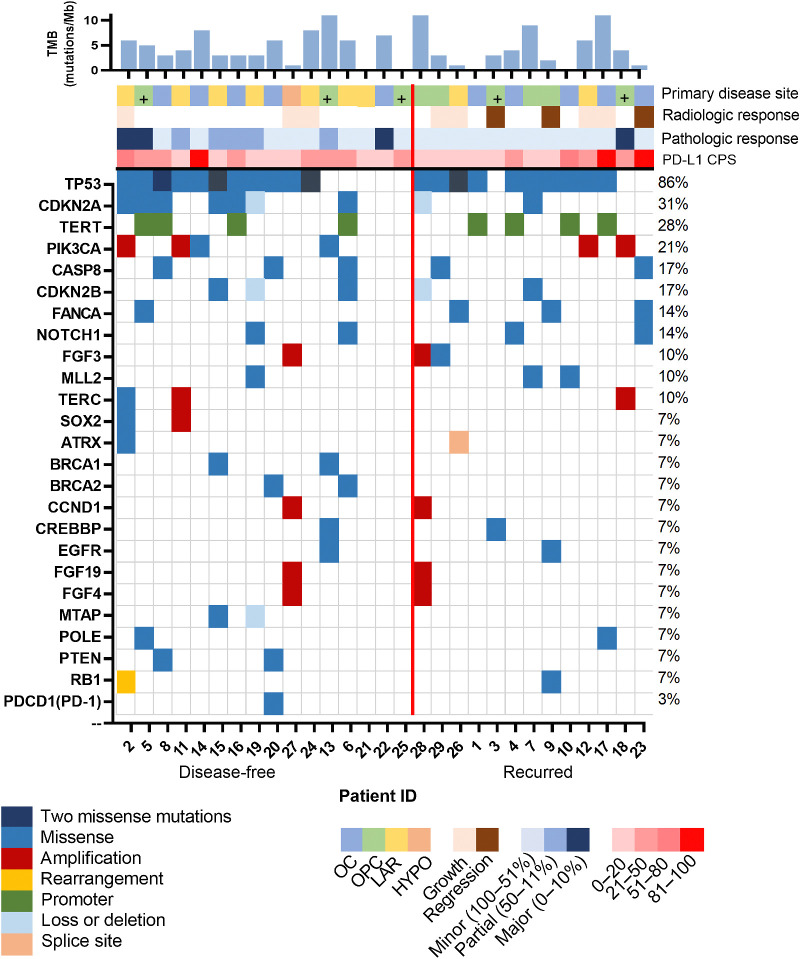
Figure 4.
Mutational landscape plot showing the most commonly mutated genes arranged by frequency (top to bottom). Each column represents an individual patient's tumor sample obtained at the time of salvage surgery, following neoadjuvant immunotherapy grouped from left to right based on disease status (disease-free or recurrence). The bar graph at the top of the figure shows TMB in mutations/Mb. The color-coded top row tiles indicate key clinicopathologic features, including primary site of initial disease (OC, oral cavity; OPC, oropharynx; “+” human papillomavirus positive; LAR, larynx; HYPO, hypopharynx), radiologic response to neoadjuvant immunotherapy prior to salvage surgery (RECIST v1.1), pathologic response graded by degree of viable tumor remaining in the surgical specimen (≤50%, partial response and ≤10% major response), and PD-L1 CPS determined from the salvage surgical specimen.

