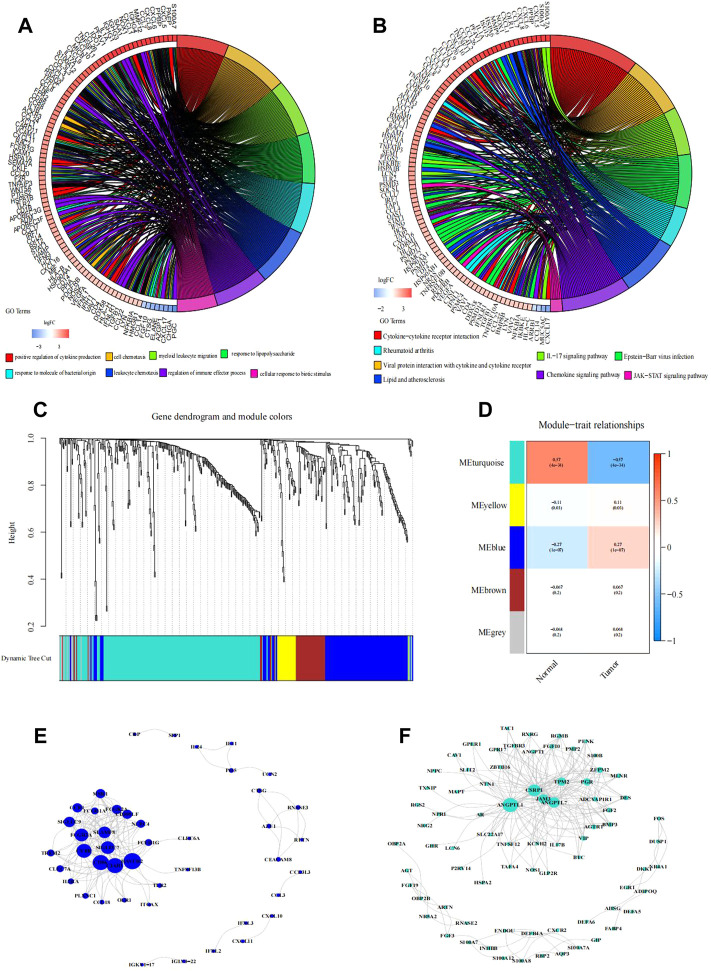
FIGURE 2.
Functional enrichment analysis of differentially expressed IRGs. (A,B) Right shows significantly enriched GO or KEGG terms. Each bar on the left represents a gene, and the depth of the color represents the logFC value of the gene. The intermediate line represents the connections between genes and GO or KEGG terms. Identification of immune-related hub genes. (C–F) Gene dendrogram and module colors. (D) Module-trait relationships. WGCNA of immune-related DEGs with the soft threshold β = 3. (E) Network of the genes in the blue module (Weight of edge > 0.2). (F) Network of the genes in the turquoise module (Weight of edge > 0.2). The size of the circle indicates the number of genes in the enrichment pathway, the color of the circle indicates the approximation between different pathways, and the link indicates the genes in the enrichment pathway.

