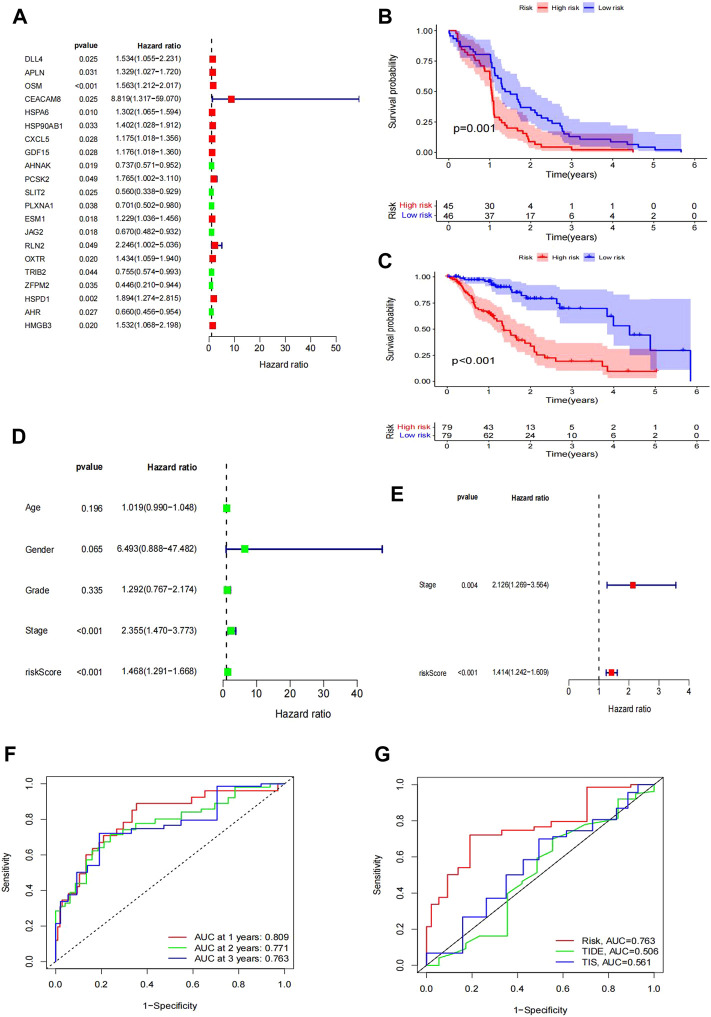
FIGURE 3.
Construction of the IRG signature as a prognostic model. (A) Forest plot of hazard ratios showing the prognostic values of genes, in which the unadjusted hazard ratios, as well as the corresponding 95% confidence intervals, are displayed. (B–C) Survival plot of patient prognosis. (B) Survival analysis between the high-risk group and low-risk group of the TCGA test group. (C) Survival analysis between the high-risk group and low-risk group of the GEO training group. Forest plot of univariate and multivariate Cox regression analyses. (D–E) Uni-forest of the clinicopathological parameters: age, sex, grade, stage, and risk score of 171 EC patients. (E) Multi-forest of the clinicopathological parameter stage and risk score of the eight-gene module. (F–G) Comparison of the modules we established. (F) ROC curve lines of the patient at 1 year (p = 0.809), 2 years (p = 0.771), and 3 years (p = 0.763). (G) Comparison of the curve under the risk AUC (p = 0.763), TIDE AUC (p = 0.506), and TIS AUC (p = 0.561) samples.

