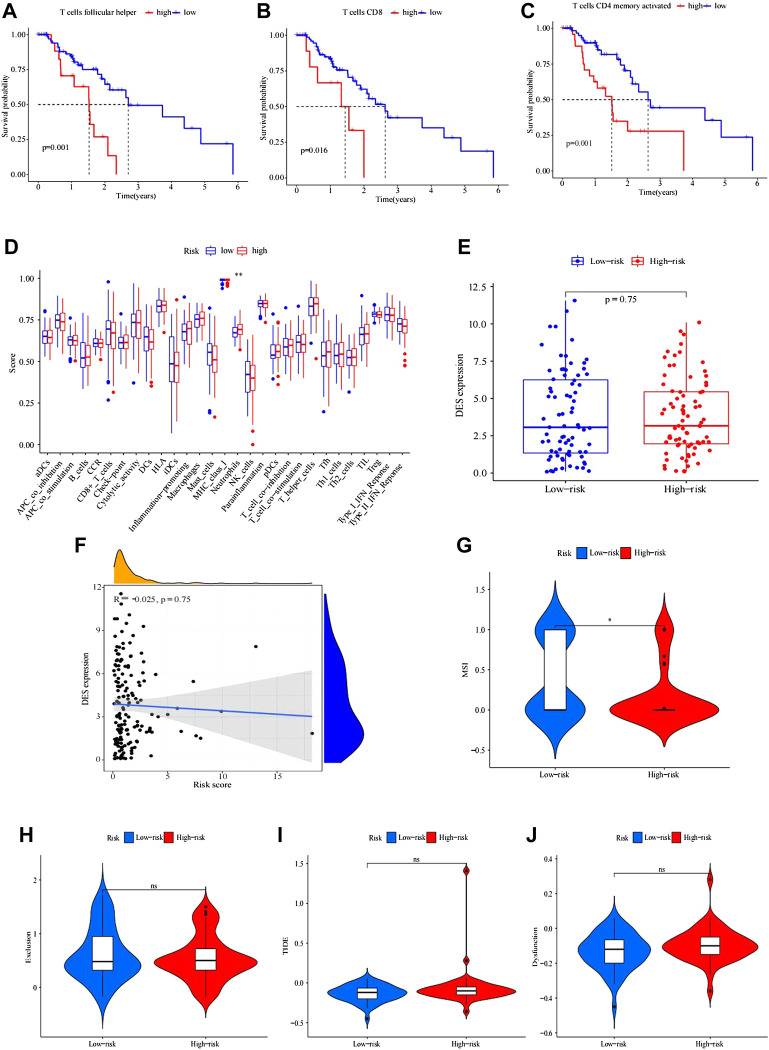
FIGURE 5.
Kaplan–Meier survival analysis of immune-related cells in IRGPI subgroups. (A–C) Differences in follicular helper T cells between IRGPI subgroups. (B) CD8 T cells were different between IRGPI subgroups. (C) CD4 memory-activated T cells differed between the IRGPI subgroups (p < 0.05). (D) Molecular- and immune-related functions of different IRGPI subgroups. The molecular- and immune-related gene sets of the IRGPI were analyzed by single-sample gene set enrichment analysis (ssGSEA), and the differences between different IRGPI subgroups were compared. Scatter points represent the ssGSEA scores of the two subgroups. Thick lines indicate median values. The bottom and top of the box are the 25th and 75th percentiles (quartile range), respectively. Significant differences between the two subgroups were tested by the Wilcoxon test (NS: not significant, * * *p < 0.05, p < 0.01, ***p < 0.001). Analysis of mutation load difference in the tumor. (E–F) Boxplot of differences in tumor mutation load between high and low IRGPI. (F) Correlation test analysis of patient risk score and tumor mutation burden. (p = 0.023, R = 0.18) Immune escape and immunotherapy of TIDE, MSI, exclusion, and dysfunction score in different IRGPI subgroups. (G–J) Violin plot of exclusion between the IRGPI subgroups. (H) Violin plot of dysfunction between the IRGPI subgroups. (I) Violin plot of MSI between the IRGPI subgroups. (J) Violin plot of TIDE scores between the IRGPI subgroups. The scores between the two IRGPI subgroups were compared through the Wilcoxon test (ns, not significant; *, p < 0.05; ***, p < 0.001).

