. 2021 Aug 10;27(21):5878–5890. doi: 10.1158/1078-0432.CCR-21-1200

Figure 5.

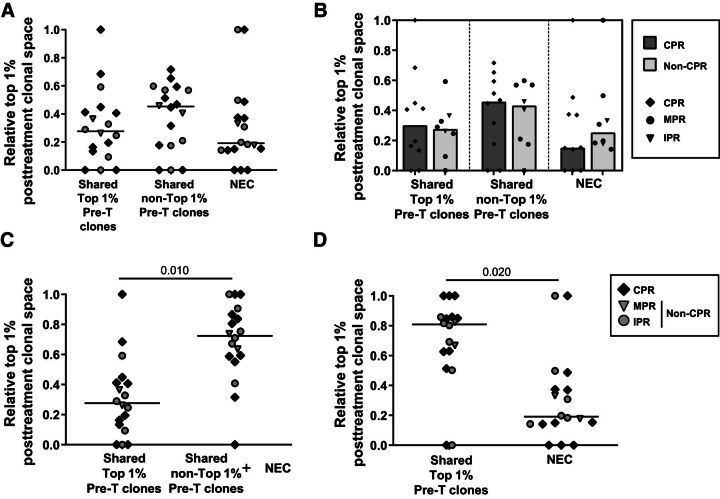
Figure 5. Composition of top 1% clones of surgical specimens. A, Relative top 1% posttreatment clonal space occupied by clones shared between pre- and posttreatment, belonging to the top 1% pre-T tissue or non–top 1%, and by NEC (n = 18; CPR, n = 10; non-CPR, n = 8). Comparisons between shared top 1% pre-T clones, shared non–top 1% pre-T clones, and NEC were done. B, Relative top 1% posttreatment clonal space occupied by clones shared between pre- and posttreatment, belonging to the top 1% pre-T tissue or non–top 1%, and by NEC stratified by response (n = 18; CPR, n = 10; non-CPR, n = 8). Comparisons between CPR and non-CPR patients were done. C, Comparison of the relative top 1% posttreatment clonal space occupied between shared top 1% clones and non–top 1% plus NEC (n = 18). D, Comparison of the relative top 1% posttreatment clonal space occupied between total shared clones and NEC (n = 18). Each patient is represented by a symbol. P < 0.05 was considered statistically significant. Only significant differences are shown.

Composition of top 1% clones of surgical specimens. A, Relative top 1% posttreatment clonal space occupied by clones shared between pre- and posttreatment, belonging to the top 1% pre-T tissue or non–top 1%, and by NEC (n = 18; CPR, n = 10; non-CPR, n = 8). Comparisons between shared top 1% pre-T clones, shared non–top 1% pre-T clones, and NEC were done. B, Relative top 1% posttreatment clonal space occupied by clones shared between pre- and posttreatment, belonging to the top 1% pre-T tissue or non–top 1%, and by NEC stratified by response (n = 18; CPR, n = 10; non-CPR, n = 8). Comparisons between CPR and non-CPR patients were done. C, Comparison of the relative top 1% posttreatment clonal space occupied between shared top 1% clones and non–top 1% plus NEC (n = 18). D, Comparison of the relative top 1% posttreatment clonal space occupied between total shared clones and NEC (n = 18). Each patient is represented by a symbol. P < 0.05 was considered statistically significant. Only significant differences are shown.