. 2021 Jun 9;27(16):4500–4510. doi: 10.1158/1078-0432.CCR-20-3586

Figure 2.

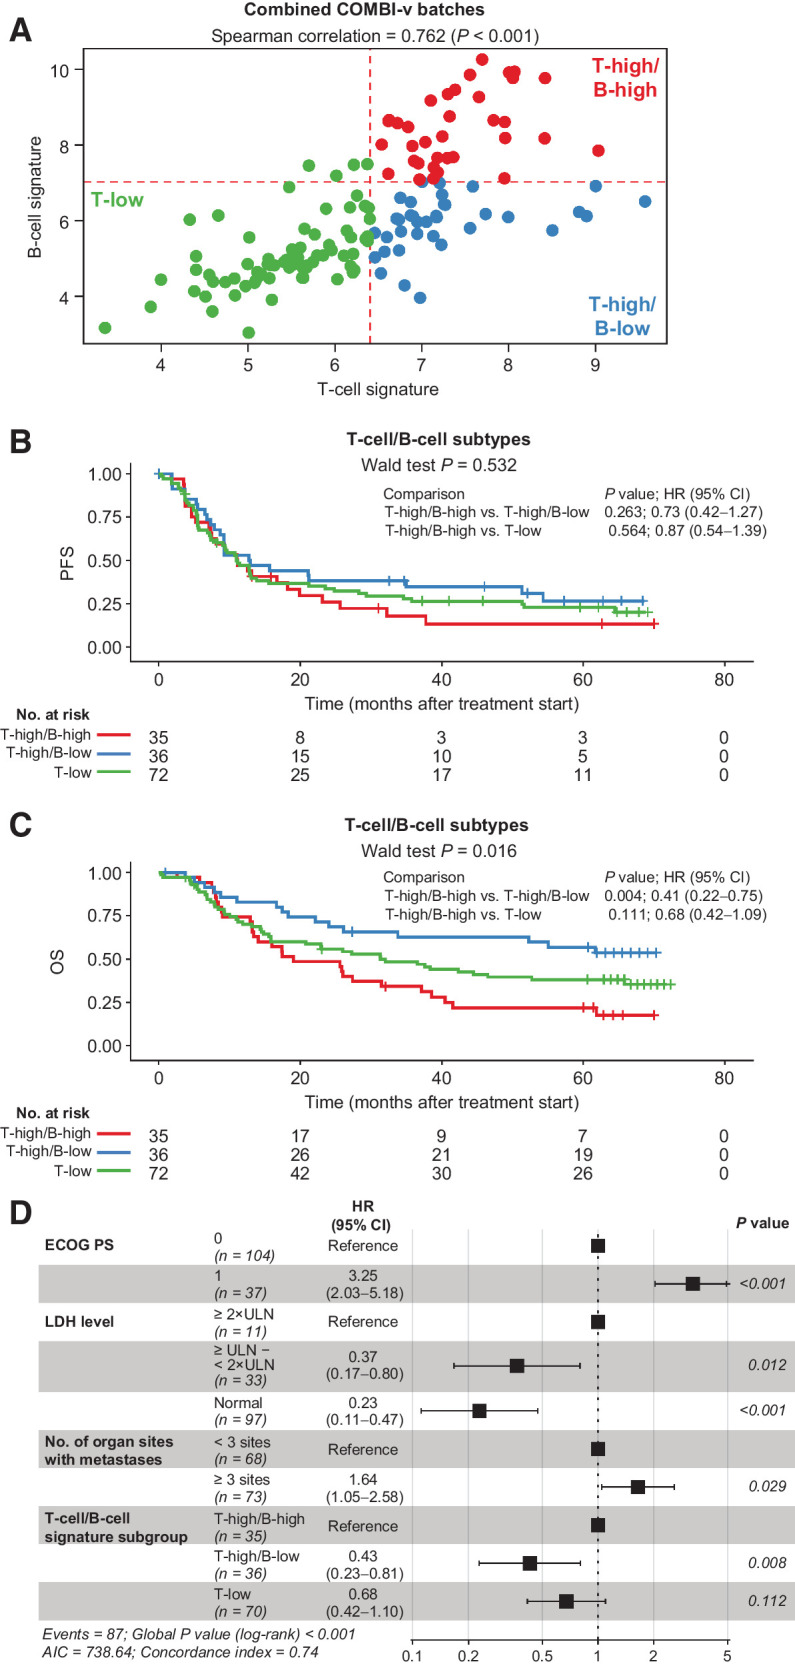
Figure 2. T- and B-cell GESs across COMBI-v tumor samples and survival outcomes. A, Patient tumor samples (n = 143) characterized by level of T-cell/B-cell signature and (B) PFS (P value was determined by Wald test) and (C) OS by T- and B-cell signature subgroup (P value was determined by Wald test). D, Multivariate analysis of baseline factors associated with OS in patients from COMBI-v (n = 141). Data were missing for two patients. P value was determined by log-rank test. AIC, Akaike information criterion; ECOG PS, Eastern Cooperative Oncology Group performance status; LDH, lactate dehydrogenase; ULN, upper limit of normal.

T- and B-cell GESs across COMBI-v tumor samples and survival outcomes. A, Patient tumor samples (n = 143) characterized by level of T-cell/B-cell signature and (B) PFS (P value was determined by Wald test) and (C) OS by T- and B-cell signature subgroup (P value was determined by Wald test). D, Multivariate analysis of baseline factors associated with OS in patients from COMBI-v (n = 141). Data were missing for two patients. P value was determined by log-rank test. AIC, Akaike information criterion; ECOG PS, Eastern Cooperative Oncology Group performance status; LDH, lactate dehydrogenase; ULN, upper limit of normal.