. 2021 Jun 9;27(16):4500–4510. doi: 10.1158/1078-0432.CCR-20-3586

Figure 3.

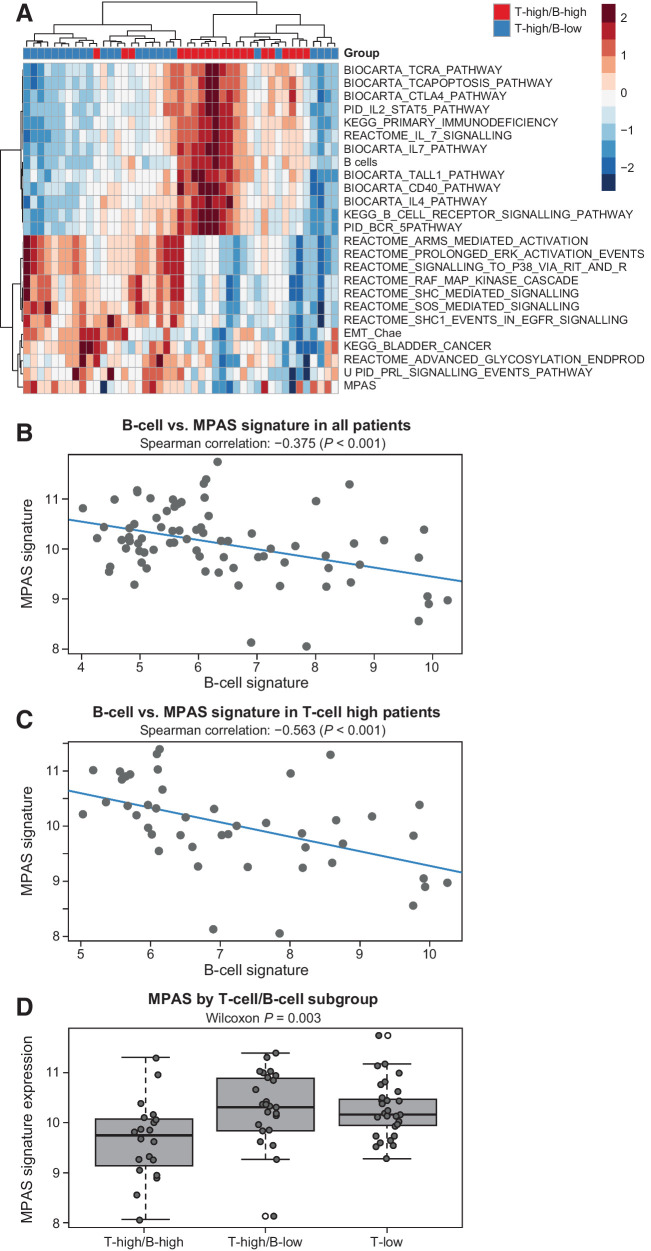
Figure 3. MPAS signature versus T-cell/B-cell GESs in COMBI-v. A, Upregulated (>0) and downregulated (<0) genes from pathway analysis in COMBI-v tumor samples by T-cell/B-cell subgroup; T-high/B-high (n = 20), T-high/B-low (n = 25). B, Correlation analysis of MPAS and B-cell signature in patients included in the biomarker cohort from COMBI-v (n = 76; P value was determined by Spearman correlation test) and (C) in patients with high T-cell signature (n = 45; P value was determined by Spearman correlation test). D, MPAS signature expression by T-cell/B-cell subgroup. A box plot shows median with interquartile range (P value was determined by two-sided Wilcoxon signed-rank test).

MPAS signature versus T-cell/B-cell GESs in COMBI-v. A, Upregulated (>0) and downregulated (<0) genes from pathway analysis in COMBI-v tumor samples by T-cell/B-cell subgroup; T-high/B-high (n = 20), T-high/B-low (n = 25). B, Correlation analysis of MPAS and B-cell signature in patients included in the biomarker cohort from COMBI-v (n = 76; P value was determined by Spearman correlation test) and (C) in patients with high T-cell signature (n = 45; P value was determined by Spearman correlation test). D, MPAS signature expression by T-cell/B-cell subgroup. A box plot shows median with interquartile range (P value was determined by two-sided Wilcoxon signed-rank test).