. 2021 Oct 29;28(2):298–307. doi: 10.1158/1078-0432.CCR-21-2007

Figure 2.

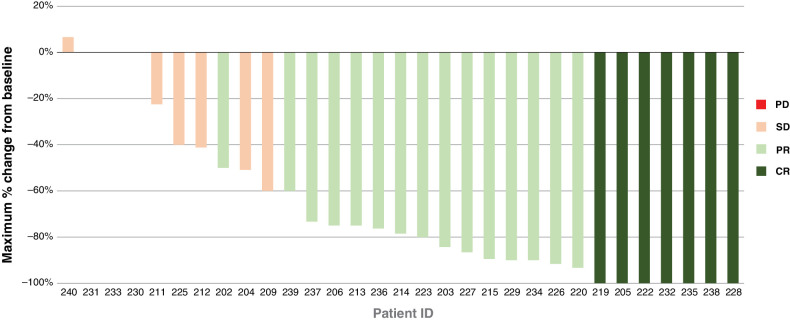
Figure 2. Maximum percentage change from baseline in TVS for patients with TGCT. The graph shows the maximum percentage change in TVS score from baseline by individual patient for the 31 MRI-evaluable patients with TGCT. Data cutoff: January 31, 2018. CR, complete response; PD, progressive disease; PR, partial response; RECIST, Response Evaluation Criteria in Solid Tumors; SD, stable disease; TGCT, tenosynovial giant cell tumor; TVS, tumor volume score.

Maximum percentage change from baseline in TVS for patients with TGCT. The graph shows the maximum percentage change in TVS score from baseline by individual patient for the 31 MRI-evaluable patients with TGCT. Data cutoff: January 31, 2018. CR, complete response; PD, progressive disease; PR, partial response; RECIST, Response Evaluation Criteria in Solid Tumors; SD, stable disease; TGCT, tenosynovial giant cell tumor; TVS, tumor volume score.