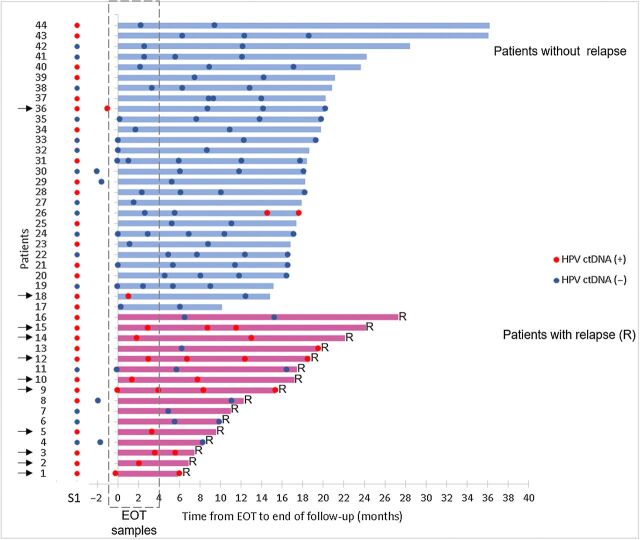
Figure 4.
HPV ctDNA dynamics from the EOT to the end of follow-up. Each line corresponds to a patient (n = 44); patients without relapse and with relapse are identified in blue (top of the figure) and red (bottom), respectively. The length of the lines (top) corresponds to the duration of follow-up. Red ( ) and blue (
 ) correspond to HPV-positive and HPV-negative serum samples, respectively. Serum samples in dashed area correspond to EOT samples. Patients with HPV ctDNA in their EOT samples are indicated by a black arrow. Diagnosis of relapse corresponds to the end of the line. S1, serum sample before treatment; R, relapse.

